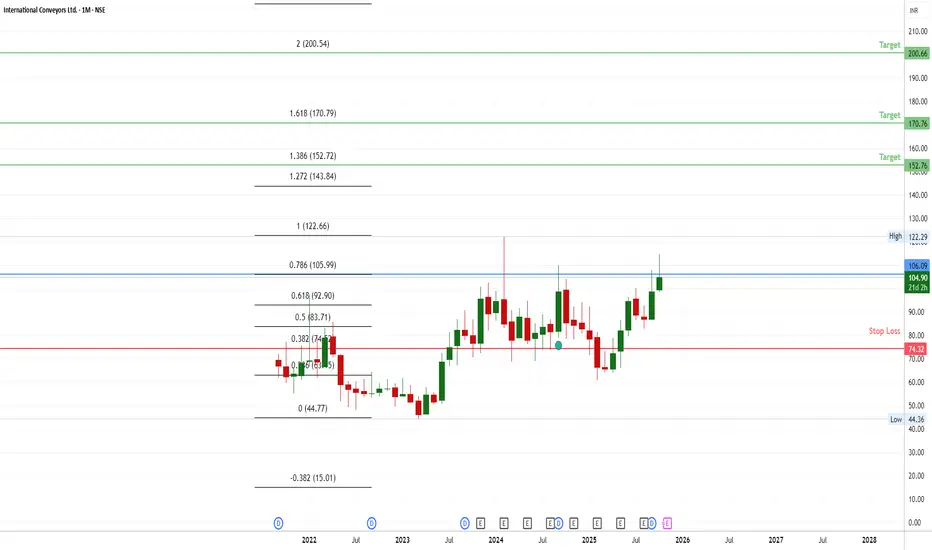
📌 Current Level: 105 (0.786 Fibonacci)
The market is hovering near this critical resistance level. A break above could signal bullish momentum.
📌 Upside Targets: 150 / 170 / 200
If the level of 105 is breached, these are the key retracement levels where price may find resistance next.
📌 Stop Loss: 74 (0.382 Fibonacci)
If the market reverses and falls below this level, it indicates a potential bearish move, making this a safe exit point.
Feragatname
Bilgiler ve yayınlar, TradingView tarafından sağlanan veya onaylanan finansal, yatırım, işlem veya diğer türden tavsiye veya tavsiyeler anlamına gelmez ve teşkil etmez. Kullanım Şartları'nda daha fazlasını okuyun.
Feragatname
Bilgiler ve yayınlar, TradingView tarafından sağlanan veya onaylanan finansal, yatırım, işlem veya diğer türden tavsiye veya tavsiyeler anlamına gelmez ve teşkil etmez. Kullanım Şartları'nda daha fazlasını okuyun.