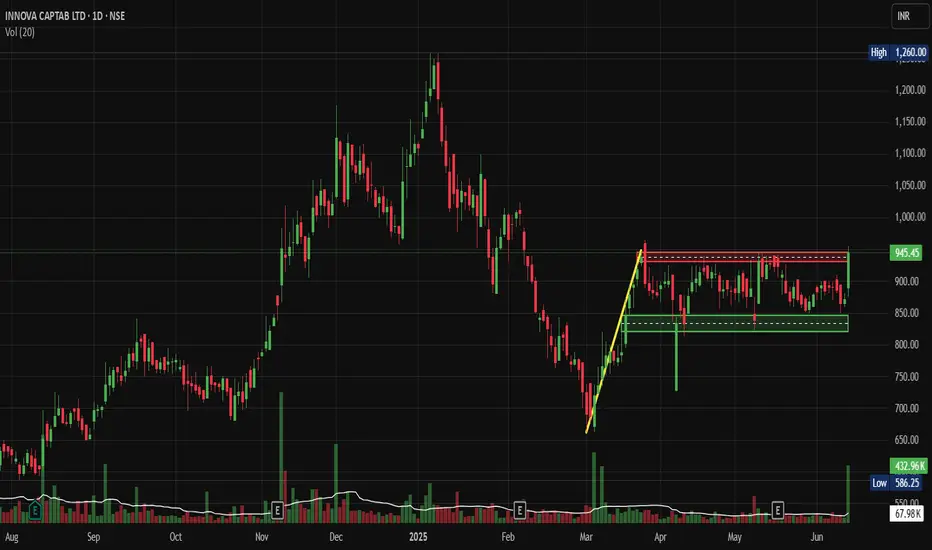
Price Action Analysis:
- Current Price: 945.45 INR (up 8.44% from previous close)
- 52-week Range: 586.25 (Low) to 1,260.00 (High)
- Stock has been consolidating in a rectangular pattern between 800-950 levels since March 2025
- Recent breakout above 945 resistance suggests renewed bullish momentum
- Price action shows a higher low formation, indicating underlying strength
Volume Analysis:
- Volume spikes coincide with price breakouts, confirming genuine moves
- Recent sessions show above-average volume supporting the current breakout
- Volume pattern suggests institutional participation during key price levels
- Low volume during consolidation phases indicates healthy profit-taking
Technical Patterns and Levels:
Base Formation:
- Primary base established around 800-850 levels from March to May 2025
- Secondary base forming at 650-700 levels (February 2025 low)
- Base shows characteristics of accumulation with controlled selling pressure
Key Support Levels:
- Immediate Support: 900-920 range
- Strong Support: 850-870 zone (previous resistance turned support)
- Major Support: 800 psychological level
- Critical Support: 750 (major trend line support)
Key Resistance Levels:
- Immediate Resistance: 970-980 zone
- Key Resistance: 1,050-1,100 (previous distribution area)
- Major Resistance: 1,200-1,260 (all-time high zone)
Technical Patterns:
- Rectangular consolidation pattern (March-May 2025)
- Flag & Pole Pattern (March Low's Then Consolidation)
- RSI showing positive divergence during recent consolidation
Trade Setup:
Long Position Setup:
- Entry Strategy: Breakout above 950 with volume confirmation
- Momentum Entry: 955-960 on sustained breakout
- Retracement Entry: 920-930 on any pullback to support
Entry Levels:
- Aggressive Entry: 950-955 (immediate breakout)
- Conservative Entry: 920-925 (pullback to support)
- Swing Entry: 900-910 (deeper retracement)
Exit Levels:
- Target 1: 1,020-1,050 (11-15% upside)
- Target 2: 1,150-1,200 (25-30% upside)
- Target 3: 1,350-1,400 (45-50% extension target)
Stop-Loss Strategy:
- For breakout trades: 920 (tight stop)
- For swing positions: 880 (wider stop)
- Trail stops above each support level as price advances
Position Sizing:
- Conservative approach: 2-3% of portfolio
- Moderate risk: 4-5% of portfolio
- Aggressive traders: 6-8% maximum allocation
Risk Management:
- Risk-reward ratio: Minimum 1:2 preferred
- Maximum loss per trade: 3-4% from entry
- Scale out profits at resistance levels
- Use trailing stops to protect gains
- Monitor sector rotation and market sentiment
Sectoral and Fundamental Backdrop:
Pharmaceutical Sector Overview:
- Indian pharma sector peers include Sun Pharmaceutical, Divis Laboratories, Cipla, Torrent Pharmaceuticals, and Mankind Pharma
- CDMO (Contract Development and Manufacturing Organization) segment showing strong growth
- Regulatory environment favourable for quality manufacturers
- Export opportunities in generic formulations are expanding
Company Fundamentals:
- Market Cap: 5,450 Crore (up 92.2% in 1 year)
- Revenue: 1,244 Cr with Profit: 128 Cr
- Founded in 2006, focused on CDMO services for pharmaceutical formulations
- Annual revenue growth of 17% with a healthy pre-tax margin of 13.74%
- ROE of 14.3% and reasonable debt-to-equity of 35%
Business Segments:
- Provides CDMO services to Indian pharmaceutical companies
- Operates domestic branded generic business and international branded generics
- Integrated presence across the pharmaceutical value chain, including R&D, manufacturing, distribution, and exports
Key Strengths:
- Stable promoter holding at 50.9%
- 19.8% YoY increase in Sales in Q4FY25
- Strong manufacturing capabilities in Baddi, Himachal Pradesh
- Diversified revenue streams across domestic and international markets
Risk Factors:
- The company is not paying dividends despite repeated profits
- Regulatory risks in the pharmaceutical sector
- Competition from larger pharma companies
- Currency fluctuation impact on export revenues
- Dependence on raw material imports
My Take:
This technical setup of Flag & Pole suggests a potential medium-term opportunity with proper risk management, though investors should monitor both technical levels and fundamental developments closely.
Keep in the Watchlist.
NO RECO. For Buy/Sell.
📌Thank you for exploring my idea! I hope you found it valuable.
🙏FOLLOW for more
👍BOOST if you found it useful.
✍️COMMENT below with your views.
Meanwhile, check out my other stock ideas on the right side until this trade is activated. I would love your feedback.
Disclaimer: "I am not a SEBI REGISTERED RESEARCH ANALYST AND INVESTMENT ADVISER."
This analysis is intended solely for informational and educational purposes and should not be interpreted as financial advice. It is advisable to consult a qualified financial advisor or conduct thorough research before making investment decisions.
İlgili yayınlar
Feragatname
Bilgiler ve yayınlar, TradingView tarafından sağlanan veya onaylanan finansal, yatırım, işlem veya diğer türden tavsiye veya tavsiyeler anlamına gelmez ve teşkil etmez. Kullanım Şartları'nda daha fazlasını okuyun.
İlgili yayınlar
Feragatname
Bilgiler ve yayınlar, TradingView tarafından sağlanan veya onaylanan finansal, yatırım, işlem veya diğer türden tavsiye veya tavsiyeler anlamına gelmez ve teşkil etmez. Kullanım Şartları'nda daha fazlasını okuyun.