⚠️ Disclaimer: This chart is for educational purposes only.
Price Action & Resistance Analysis
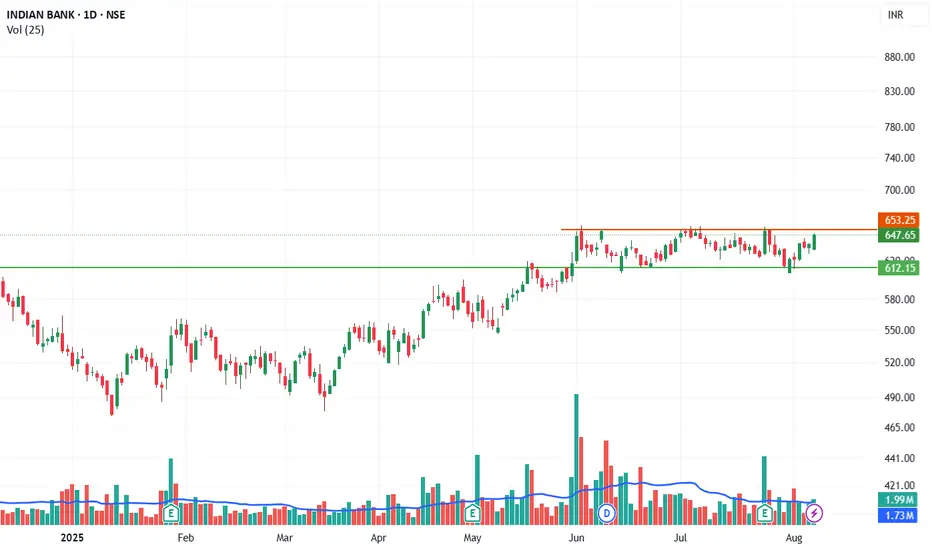
Current Market Price: ₹647
Upper Resistance Zone: ₹653
This level has been tested multiple times since early June but has not yet been convincingly broken, indicating a strong horizontal resistance.
Support Level: ₹610
This is a well-defined support line that has held multiple times in the last couple of months. It marks the lower bound of the consolidation zone.
Price Structure:
The stock is in a broad consolidation range between ₹612 and ₹653 for over two months.
Repeated higher lows within this range show a bullish bias and buildup towards a potential breakout.
The stock is currently approaching the resistance zone again, which indicates a third or fourth retest—often a precursor to a breakout.
Technical Outlook & Strategy
Bias: Moderately Bullish (until breakout confirmation)
Breakout Trigger: Daily close above ₹653.25 with volume > 2.5M
Short-Term Target (Post Breakout): ₹680 – ₹700
Stop Loss for Longs: Below ₹610 (strong support level)
Indian Bank is currently in a tight range between ₹612 and ₹653, with signs of accumulation and strengthening momentum. A breakout above ₹653.25 with convincing volume could unlock the next leg up. Traders should watch for a volume-backed move above resistance, while investors may consider this as a potential accumulation zone before a medium-term rally.
Regulatory Note: We are an independent development team. Our services are not registered or licensed by any regulatory body in India, the U.S., the U.K., or any global financial authority. Please consult a licensed advisor before making trading decisions.
Price Action & Resistance Analysis
Current Market Price: ₹647
Upper Resistance Zone: ₹653
This level has been tested multiple times since early June but has not yet been convincingly broken, indicating a strong horizontal resistance.
Support Level: ₹610
This is a well-defined support line that has held multiple times in the last couple of months. It marks the lower bound of the consolidation zone.
Price Structure:
The stock is in a broad consolidation range between ₹612 and ₹653 for over two months.
Repeated higher lows within this range show a bullish bias and buildup towards a potential breakout.
The stock is currently approaching the resistance zone again, which indicates a third or fourth retest—often a precursor to a breakout.
Technical Outlook & Strategy
Bias: Moderately Bullish (until breakout confirmation)
Breakout Trigger: Daily close above ₹653.25 with volume > 2.5M
Short-Term Target (Post Breakout): ₹680 – ₹700
Stop Loss for Longs: Below ₹610 (strong support level)
Indian Bank is currently in a tight range between ₹612 and ₹653, with signs of accumulation and strengthening momentum. A breakout above ₹653.25 with convincing volume could unlock the next leg up. Traders should watch for a volume-backed move above resistance, while investors may consider this as a potential accumulation zone before a medium-term rally.
Regulatory Note: We are an independent development team. Our services are not registered or licensed by any regulatory body in India, the U.S., the U.K., or any global financial authority. Please consult a licensed advisor before making trading decisions.
Creator of “VaultSignal Weekly, SignalSurge Daily, ProChart Future Hourly, – Invite-only scripts. Access available via profile. t.me/+Mdc4fo9qxn8zNzI1
Feragatname
Bilgiler ve yayınlar, TradingView tarafından sağlanan veya onaylanan finansal, yatırım, işlem veya diğer türden tavsiye veya tavsiyeler anlamına gelmez ve teşkil etmez. Kullanım Şartları'nda daha fazlasını okuyun.