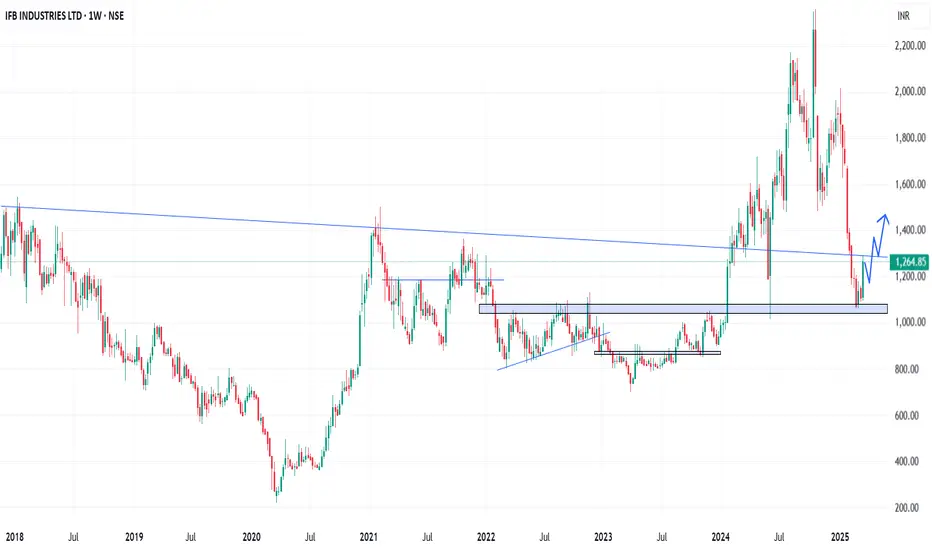
In the Weekly Chart of IFBIND ,
we can see that; it has given a bounce back from Support of 1080-1100 Trendline.
wait for a Halt or retrace candle and then enter with SL and Targets.
Expected momentum is shared in chart.
we can see that; it has given a bounce back from Support of 1080-1100 Trendline.
wait for a Halt or retrace candle and then enter with SL and Targets.
Expected momentum is shared in chart.
Feragatname
The information and publications are not meant to be, and do not constitute, financial, investment, trading, or other types of advice or recommendations supplied or endorsed by TradingView. Read more in the Terms of Use.
Feragatname
The information and publications are not meant to be, and do not constitute, financial, investment, trading, or other types of advice or recommendations supplied or endorsed by TradingView. Read more in the Terms of Use.