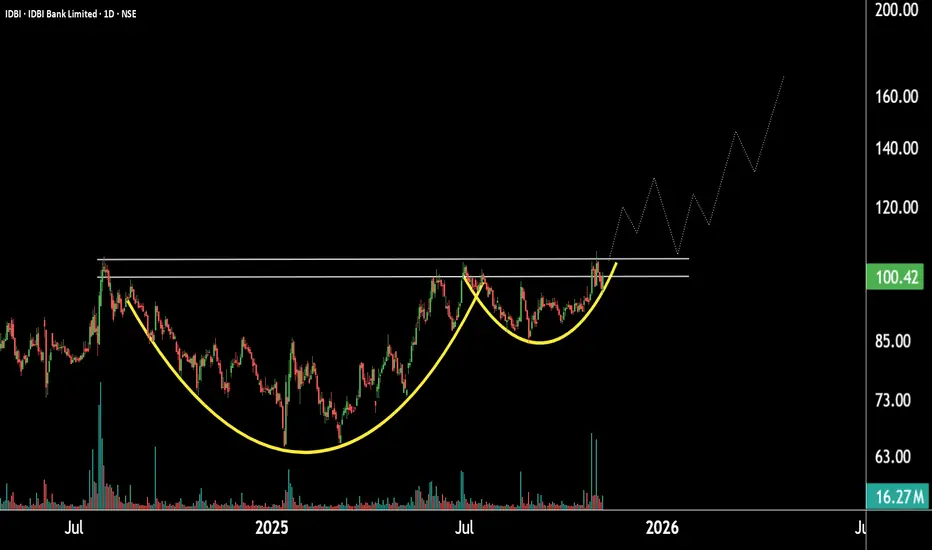
This is the daily timeframe chart of IDBI Bank.
The stock is forming a Cup and Handle pattern on the daily timeframe, with a strong support zone near the 90–95 range. If the current rally continues and the stock breaks out of this pattern, it may move toward the 130 level, followed by 165.
If the support zone holds, IDBI Bank could witness higher prices in the coming sessions.
Thank you.
@RahulSaraoge
Connect us at t.me/stridesadvisory
Connect us at t.me/stridesadvisory
Feragatname
Bilgiler ve yayınlar, TradingView tarafından sağlanan veya onaylanan finansal, yatırım, alım satım veya diğer türden tavsiye veya öneriler anlamına gelmez ve teşkil etmez. Kullanım Koşulları bölümünde daha fazlasını okuyun.