This is a chart that I sent to my members today.
It presents two potential trades on IBB:
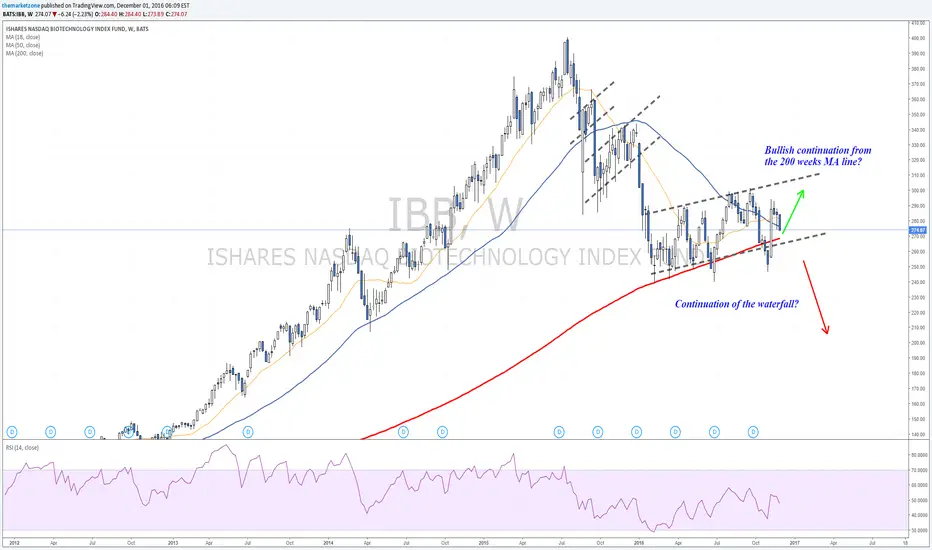
1. Bullish (short term) setup - 270$ is the key zone as it presents a weekly support zone.
2. Bearish continuation (based on longer term analysis) - Continuation of the the waterfall that started on May 2015.
Waiting to here your thoughts.
It presents two potential trades on IBB:
1. Bullish (short term) setup - 270$ is the key zone as it presents a weekly support zone.
2. Bearish continuation (based on longer term analysis) - Continuation of the the waterfall that started on May 2015.
Waiting to here your thoughts.
Not
Despite Trump's comments, IBB holds the bottom of the channel. 270$ is nearest support.
Feragatname
Bilgiler ve yayınlar, TradingView tarafından sağlanan veya onaylanan finansal, yatırım, işlem veya diğer türden tavsiye veya tavsiyeler anlamına gelmez ve teşkil etmez. Kullanım Şartları'nda daha fazlasını okuyun.
Feragatname
Bilgiler ve yayınlar, TradingView tarafından sağlanan veya onaylanan finansal, yatırım, işlem veya diğer türden tavsiye veya tavsiyeler anlamına gelmez ve teşkil etmez. Kullanım Şartları'nda daha fazlasını okuyun.