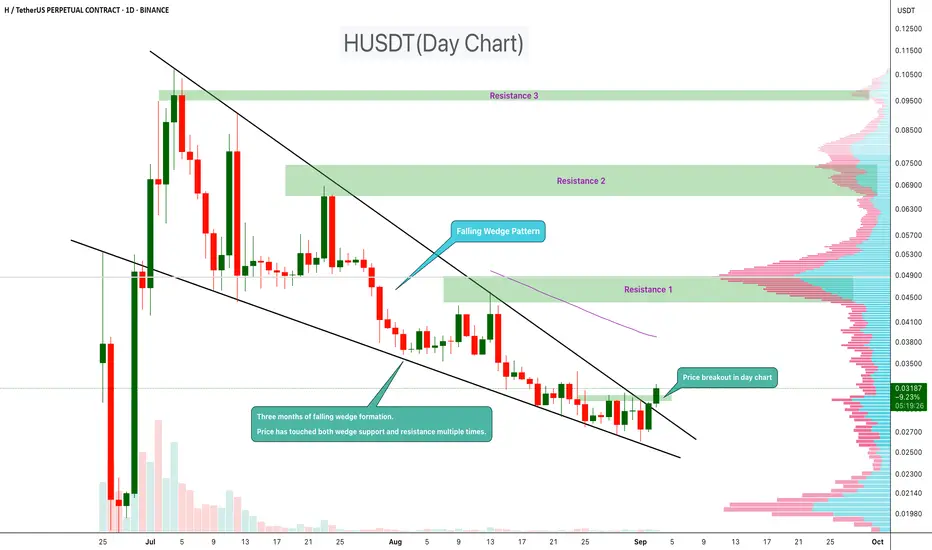
HUSDT has been forming a falling wedge pattern over the past three months. During this period, the price has tested both the wedge support and resistance multiple times, confirming the structure.
Now, a breakout has appeared on the daily chart, suggesting that bullish momentum may be building. Falling wedges are typically seen as reversal patterns, often leading to upside continuation once the breakout is confirmed.
Resistance 1:$0.045
Resistance 2:$0.066
Resistance 2:$0.095
cheers
Hexa
Now, a breakout has appeared on the daily chart, suggesting that bullish momentum may be building. Falling wedges are typically seen as reversal patterns, often leading to upside continuation once the breakout is confirmed.
Resistance 1:$0.045
Resistance 2:$0.066
Resistance 2:$0.095
cheers
Hexa
İşlem aktif
50%+ profit
🚀Telegram : t.me/hexatrades
🌐Website: hexatrades.io/
🗣️Twitter(X): twitter.com/HexaTrades
🌐Website: hexatrades.io/
🗣️Twitter(X): twitter.com/HexaTrades
İlgili yayınlar
Feragatname
Bilgiler ve yayınlar, TradingView tarafından sağlanan veya onaylanan finansal, yatırım, alım satım veya diğer türden tavsiye veya öneriler anlamına gelmez ve teşkil etmez. Kullanım Koşulları bölümünde daha fazlasını okuyun.