📊 1-Week Technical Overview
Price Change: HSCL has gained approximately 3.35% over the past week.
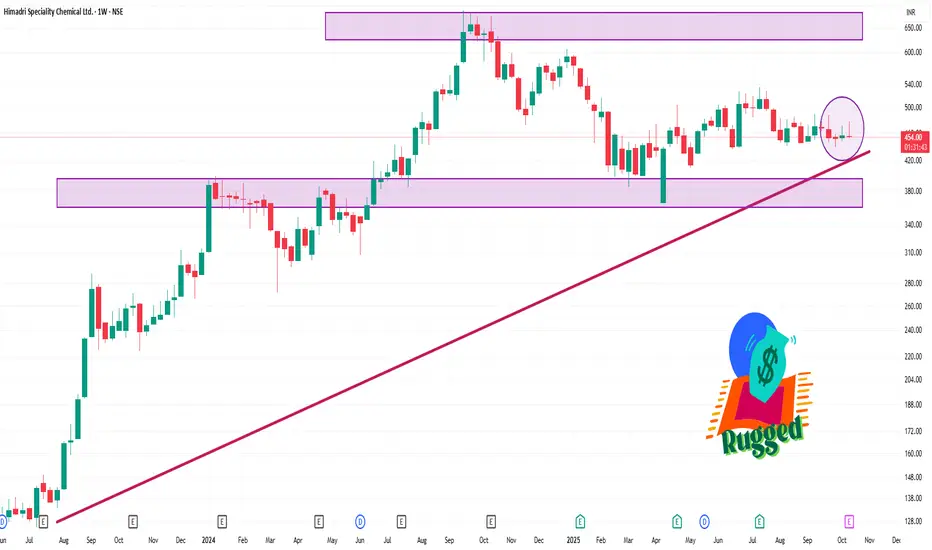
Day Range: ₹458.60 – ₹469.55
52-Week Range: ₹365.35 – ₹676.20
Volume: 535,912 shares traded
📈 Technical Indicators
Relative Strength Index (RSI): 36.75, suggesting a neutral to slightly oversold condition.
Moving Averages: Short-term (5-day) and medium-term (50-day) moving averages indicate a neutral to slightly bearish outlook.
MACD: The Moving Average Convergence Divergence indicator is negative, reinforcing a bearish sentiment.
Price Change: HSCL has gained approximately 3.35% over the past week.
Day Range: ₹458.60 – ₹469.55
52-Week Range: ₹365.35 – ₹676.20
Volume: 535,912 shares traded
📈 Technical Indicators
Relative Strength Index (RSI): 36.75, suggesting a neutral to slightly oversold condition.
Moving Averages: Short-term (5-day) and medium-term (50-day) moving averages indicate a neutral to slightly bearish outlook.
MACD: The Moving Average Convergence Divergence indicator is negative, reinforcing a bearish sentiment.
İlgili yayınlar
Feragatname
Bilgiler ve yayınlar, TradingView tarafından sağlanan veya onaylanan finansal, yatırım, işlem veya diğer türden tavsiye veya tavsiyeler anlamına gelmez ve teşkil etmez. Kullanım Şartları'nda daha fazlasını okuyun.
İlgili yayınlar
Feragatname
Bilgiler ve yayınlar, TradingView tarafından sağlanan veya onaylanan finansal, yatırım, işlem veya diğer türden tavsiye veya tavsiyeler anlamına gelmez ve teşkil etmez. Kullanım Şartları'nda daha fazlasını okuyun.