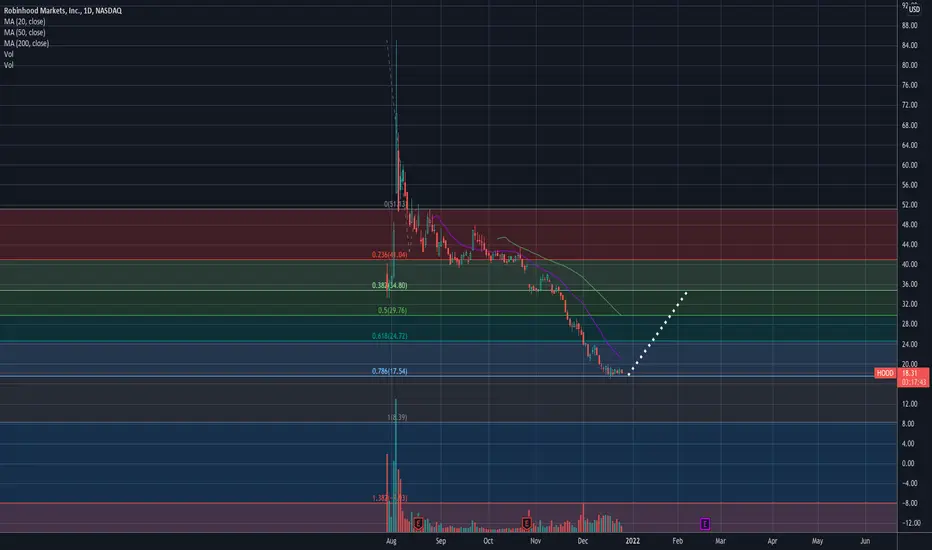
Looking like reversal is about to happen. The Oscillators - RSI, Stoch, Accdist, OBV and macd all displaying bullish divergence.
The bulls should be ready to take a loss if the price drops below $16 as this can lead to $13.7 drop zone.
Target 1 - $24
Target 2 - $34
Risk - dropping below $16 is bad.
———————————————————
How to read my charts?
- Matching color trend lines shows the pattern. Sometimes a chart can have multiple patterns. Each pattern will have matching color trend lines.
- The yellow horizontal lines shows support and resistance areas.
- Fib lines also shows support and resistance areas.
- The dotted white lines shows price projection for breakout or breakdown target.
Disclaimer: Do your own DD. Not an investment advice.
I am not a licensed professional. None of the posts that I published are investment advice. Do your own research.
Feragatname
Bilgiler ve yayınlar, TradingView tarafından sağlanan veya onaylanan finansal, yatırım, işlem veya diğer türden tavsiye veya tavsiyeler anlamına gelmez ve teşkil etmez. Kullanım Şartları'nda daha fazlasını okuyun.