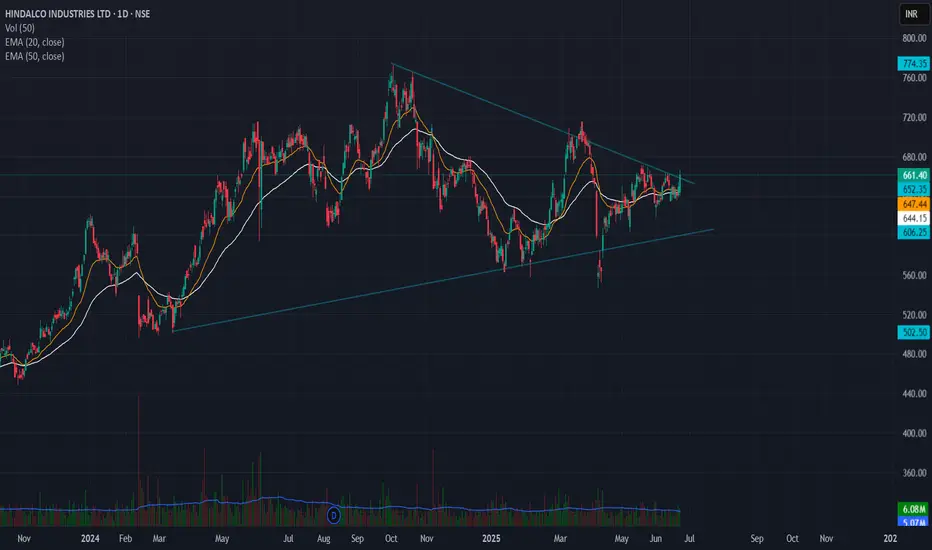
🔹 Pattern: Symmetrical Triangle
🔹 Breakout Level: ₹660
🔹 Stoploss: ₹635 (below swing low)
🔹 Target Zone: ₹850 – ₹900
🔹 Risk–Reward: 7.6 – 9.6
🔹 Timeframe: Positional (swing to medium term)
---
📊 Chart Analysis:
Hindalco has broken out of a well-defined symmetrical triangle on the daily chart, with strong price compression followed by bullish breakout confirmation.
The triangle height is ~₹200, projected from the breakout zone, giving a target range of ₹850–₹900.
🧠 Stoploss placed below the last swing low inside the triangle to avoid false breakdown traps.
Feragatname
Bilgiler ve yayınlar, TradingView tarafından sağlanan veya onaylanan finansal, yatırım, alım satım veya diğer türden tavsiye veya öneriler anlamına gelmez ve teşkil etmez. Kullanım Koşulları bölümünde daha fazlasını okuyun.
Feragatname
Bilgiler ve yayınlar, TradingView tarafından sağlanan veya onaylanan finansal, yatırım, alım satım veya diğer türden tavsiye veya öneriler anlamına gelmez ve teşkil etmez. Kullanım Koşulları bölümünde daha fazlasını okuyun.