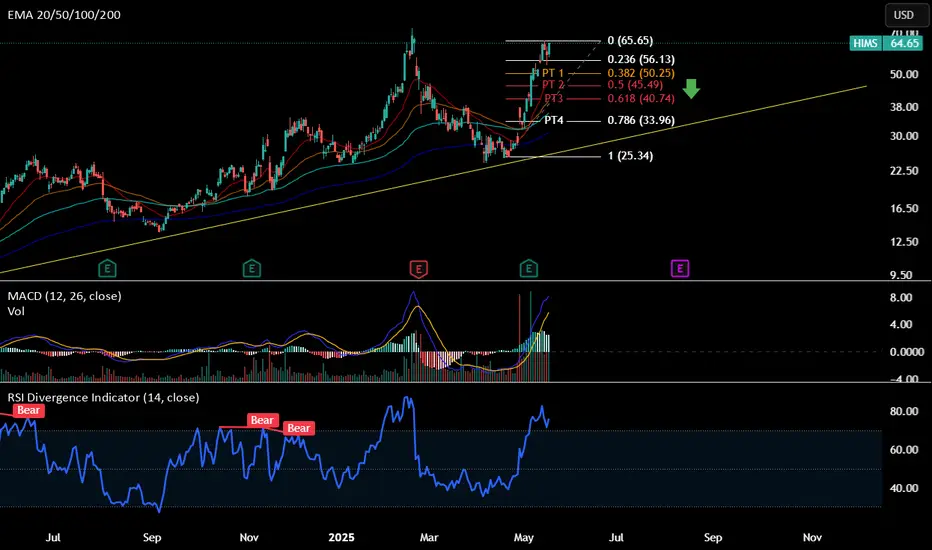
Long-term trend line: Rising trend line -> short-term bearish due to expected trend line retest (yellow trend line)
Daily MACD & RSI : Overbought -> expect a pull back
Support Line to enter PUT: ~$54
Expected time zone for pullback: 30 days to 50 days
PT1: ~50.25
PT2: ~45.49
PT3: ~40.74
PT4: ~34.96
Possible PT5: expect to cross down the EMA 200 at ~$27, which is close to the trendline support. However, I'll exit all play at PT4.
İşlem aktif
Support line breaks -> PUT activeNot
Take profits from one time hits $54 and today at 52.5$54 is a very stubborn support
Not
PUT option if $51 breaksStop loss: ~54
HIMS seems like it wants to retest the ATH ~72.9 as it has been accumulating for days in range 51.8 -56
İşlem kapandı: hedefe ulaştı
Not
HIMS rejected hard at the resistance at $67-> this PUT play to reach PT 2 might be active again if it breaks support at $51.3Feragatname
Bilgiler ve yayınlar, TradingView tarafından sağlanan veya onaylanan finansal, yatırım, alım satım veya diğer türden tavsiye veya öneriler anlamına gelmez ve teşkil etmez. Kullanım Koşulları bölümünde daha fazlasını okuyun.
Feragatname
Bilgiler ve yayınlar, TradingView tarafından sağlanan veya onaylanan finansal, yatırım, alım satım veya diğer türden tavsiye veya öneriler anlamına gelmez ve teşkil etmez. Kullanım Koşulları bölümünde daha fazlasını okuyun.