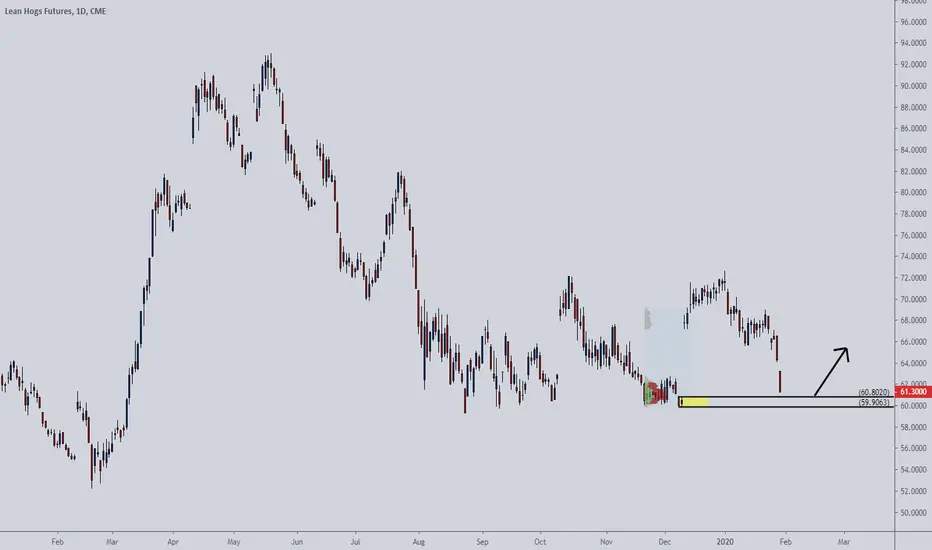
A long red candle has formed on the daily chart. A strong gap down, however, I identified a volume cluster just below the current price. If buyers are strong, they will push the price up again. A strong demand zone is also just below the current price.
Our target is 1 to 1, and the stop is a close, on the daily chart, below the lower line.
Our target is 1 to 1, and the stop is a close, on the daily chart, below the lower line.
Feragatname
Bilgiler ve yayınlar, TradingView tarafından sağlanan veya onaylanan finansal, yatırım, alım satım veya diğer türden tavsiye veya öneriler anlamına gelmez ve teşkil etmez. Kullanım Koşulları bölümünde daha fazlasını okuyun.
Feragatname
Bilgiler ve yayınlar, TradingView tarafından sağlanan veya onaylanan finansal, yatırım, alım satım veya diğer türden tavsiye veya öneriler anlamına gelmez ve teşkil etmez. Kullanım Koşulları bölümünde daha fazlasını okuyun.