STOCK TREND - Sideways to Bullish
MULTI TF ANALYSIS
==================
MONTHLY - Price is trading near ATH
WEEKLY - [2-3] Week Consolidation near ATH
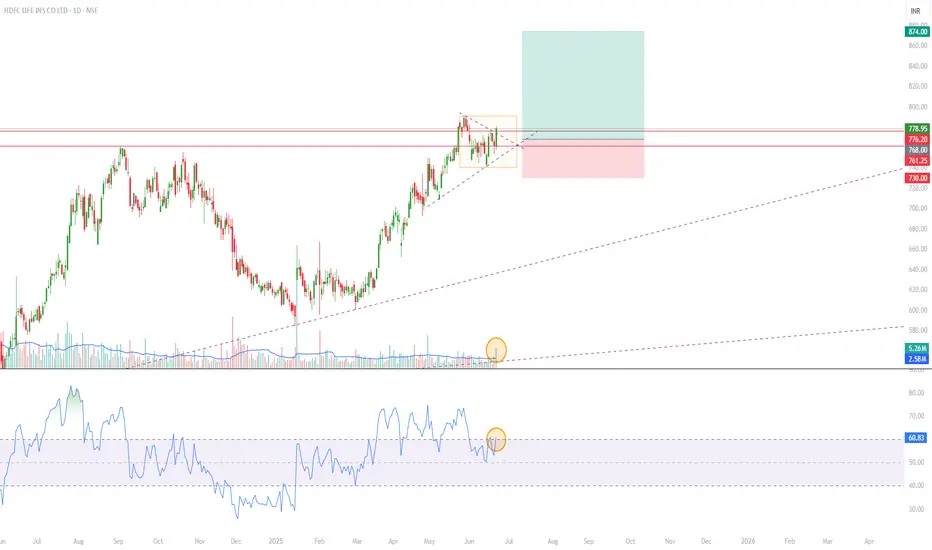
DAILY - Symmentrical Triangle breakout near ATH
TECHNICAL ANALYSIS
===================
Symmentrical Triangle breakout with Volume and RSI confirmation
Stock Price is trading above [50, 100, 200] SMAs
RSI > [60]
VOLUME > [20] MA
Support/Resistance Zone - [761.20 - 775.65]
Demand Zone - NA
FUNDAMENTAL ANALYSIS
======================
Compounded Sales Growth - [-4%]
Compounded Profit Growth - [15%]
Stock Price CAGR - [34%]
Return on Equity - [12%]
Note: The stock is currently little overvalued as Stock PE(92.7) ~ Industry PE(77.3).
TRADE DESIGN
=============
ENTRY - [768]
SL - [730]
TARGET - [874]
RRR - [1:3]+
Disclaimer: This chart study is for educational purpose only. Kindly trade at your own risk.
Feragatname
Bilgiler ve yayınlar, TradingView tarafından sağlanan veya onaylanan finansal, yatırım, işlem veya diğer türden tavsiye veya tavsiyeler anlamına gelmez ve teşkil etmez. Kullanım Şartları'nda daha fazlasını okuyun.
Feragatname
Bilgiler ve yayınlar, TradingView tarafından sağlanan veya onaylanan finansal, yatırım, işlem veya diğer türden tavsiye veya tavsiyeler anlamına gelmez ve teşkil etmez. Kullanım Şartları'nda daha fazlasını okuyun.