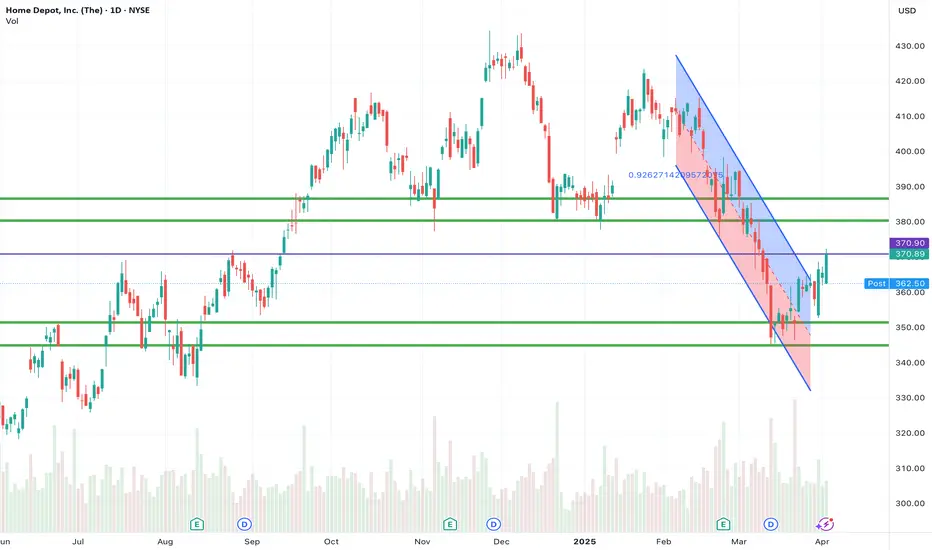
Home Depot's chart shows it just broke out of a descending channel! After a steady downtrend, it's pushing past resistance around $370. Is this the start of a sustained rally, or a temporary blip before it heads back down? Keep an eye on the next resistance level near $383 – a break above that would strengthen the bullish case. Are you betting on HD's strength, or seeing a potential pullback?
Feragatname
Bilgiler ve yayınlar, TradingView tarafından sağlanan veya onaylanan finansal, yatırım, işlem veya diğer türden tavsiye veya tavsiyeler anlamına gelmez ve teşkil etmez. Kullanım Şartları'nda daha fazlasını okuyun.
Feragatname
Bilgiler ve yayınlar, TradingView tarafından sağlanan veya onaylanan finansal, yatırım, işlem veya diğer türden tavsiye veya tavsiyeler anlamına gelmez ve teşkil etmez. Kullanım Şartları'nda daha fazlasını okuyun.