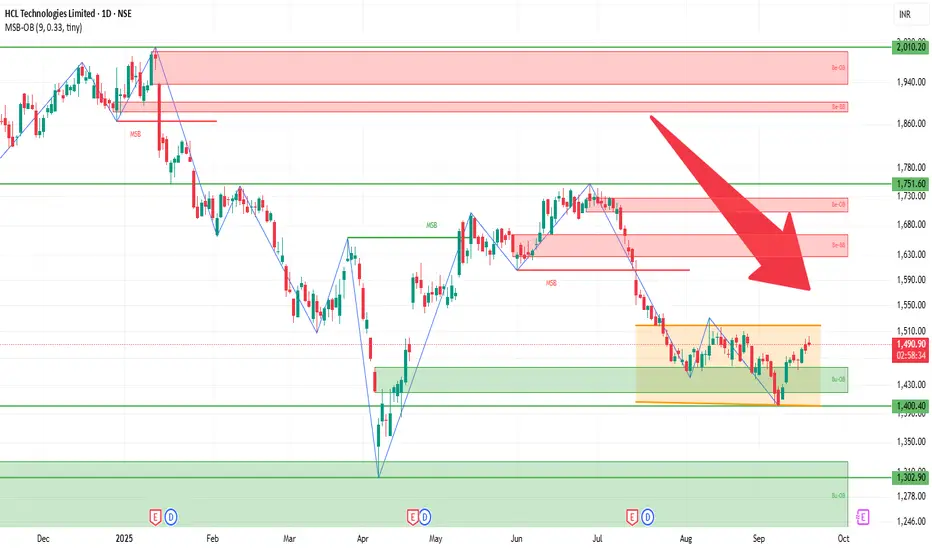
Current Picture
Share price is ~ ₹1,499-₹1,505.
Recent momentum has been upward; the stock is trading above most moving averages—short-, medium-, and long-term.
Indicators are generally favoring continuation of the uptrend.
⚙️ Indicators / Momentum
Many oscillators (RSI, MACD, CCI etc.) are in bullish territory.
Moving averages from 5-, 10-, 20-, 50-, 100- to 200‐day are all aligned bullish (price above them).
Volatility is moderate to high — good movement, but also risk of pullbacks.
📌 Key Support & Resistance Levels
Immediate Resistance: around ₹1,505-₹1,515.
Immediate Support: near ₹1,480-₹1,490.
Stronger support further down around ₹1,400-₹1,420 in case of sharper correction.
✅ Outlook & Risks
Short term bias is bullish as long as price holds above the immediate support (≈ ₹1,480).
If resistance around ₹1,510 breaks decisively, more upside is likely.
İlgili yayınlar
Feragatname
The information and publications are not meant to be, and do not constitute, financial, investment, trading, or other types of advice or recommendations supplied or endorsed by TradingView. Read more in the Terms of Use.
Feragatname
The information and publications are not meant to be, and do not constitute, financial, investment, trading, or other types of advice or recommendations supplied or endorsed by TradingView. Read more in the Terms of Use.
