📈 1-Month Performance Overview
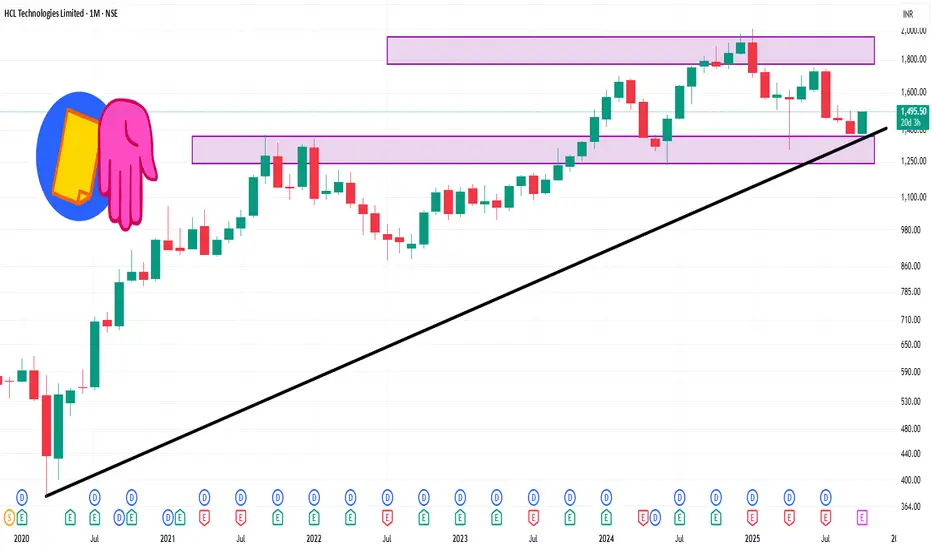
Current Price: ₹1,495.50
1-Month Change: +4.19%
52-Week Range: ₹1,302.75 – ₹2,012.20
Market Capitalization: ₹4,05,612 crore
P/E Ratio (TTM): 23.88
Dividend Yield: 4.02%
Over the past month, HCL Technologies has shown a steady upward trend, outperforming the Nifty IT Index, which has gained approximately 0.33% during the same period.
📊 Technical Snapshot
1-Month High: ₹1,502.90
1-Month Low: ₹1,380.40
Average Price: ₹1,443.09
Price Change: +2.16%
İlgili yayınlar
Feragatname
Bilgiler ve yayınlar, TradingView tarafından sağlanan veya onaylanan finansal, yatırım, alım satım veya diğer türden tavsiye veya öneriler anlamına gelmez ve teşkil etmez. Kullanım Koşulları bölümünde daha fazlasını okuyun.
İlgili yayınlar
Feragatname
Bilgiler ve yayınlar, TradingView tarafından sağlanan veya onaylanan finansal, yatırım, alım satım veya diğer türden tavsiye veya öneriler anlamına gelmez ve teşkil etmez. Kullanım Koşulları bölümünde daha fazlasını okuyun.