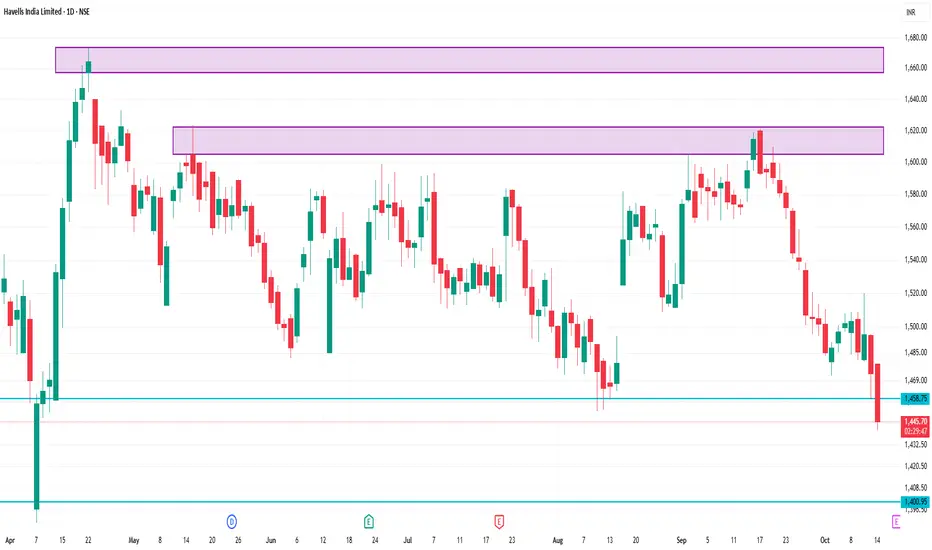
📊 Key Support and Resistance Levels
Immediate Support: ₹1,477.53
Immediate Resistance: ₹1,527.85
Short-Term Support: ₹1,497.04
Short-Term Resistance: ₹1,538.60
Fibonacci Pivot Point: ₹1,462.70
These levels are derived from standard technical analysis tools and are relevant for intraday trading strategies.
📉 Technical Indicators
Relative Strength Index (RSI): 28.62 (indicating an oversold condition)
Moving Average Convergence Divergence (MACD): -9.64 (suggesting bearish momentum)
5-Day Moving Average: ₹1,465.36
50-Day Moving Average: ₹1,490.21
200-Day Moving Average: ₹1,547.08
These indicators collectively suggest a bearish trend in the short term.
İlgili yayınlar
Feragatname
Bilgiler ve yayınlar, TradingView tarafından sağlanan veya onaylanan finansal, yatırım, alım satım veya diğer türden tavsiye veya öneriler anlamına gelmez ve teşkil etmez. Kullanım Koşulları bölümünde daha fazlasını okuyun.
İlgili yayınlar
Feragatname
Bilgiler ve yayınlar, TradingView tarafından sağlanan veya onaylanan finansal, yatırım, alım satım veya diğer türden tavsiye veya öneriler anlamına gelmez ve teşkil etmez. Kullanım Koşulları bölümünde daha fazlasını okuyun.