GSFC chart showing a hidden setup… Is this the breakout moment?
GSFC Chart Update (4H Timeframe)
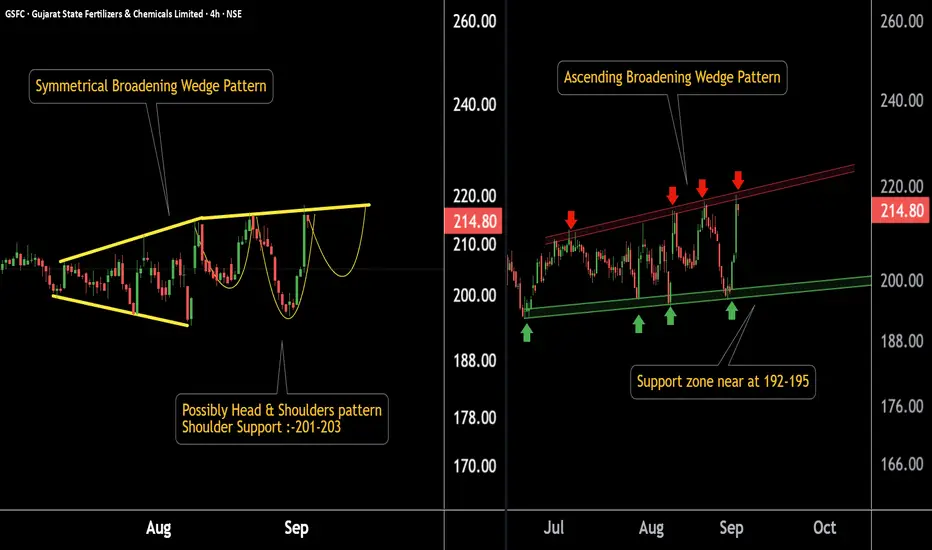
Chart 1:
Stock has formed a symmetrical broadening wedge.
If the stock respects the resistance, there is a possibility of a Head & Shoulders pattern.
Key support zone: 202 – 204.
Chart 2:
GSFC is forming an ascending broadening wedge pattern.
Support lies in the 192 – 195 range.
If this level sustains, potential pattern target is around 240.
Thank You !!
@RahulSaraoge
Connect us at t.me/stridesadvisory
Connect us at t.me/stridesadvisory
Feragatname
Bilgiler ve yayınlar, TradingView tarafından sağlanan veya onaylanan finansal, yatırım, alım satım veya diğer türden tavsiye veya öneriler anlamına gelmez ve teşkil etmez. Kullanım Koşulları bölümünde daha fazlasını okuyun.