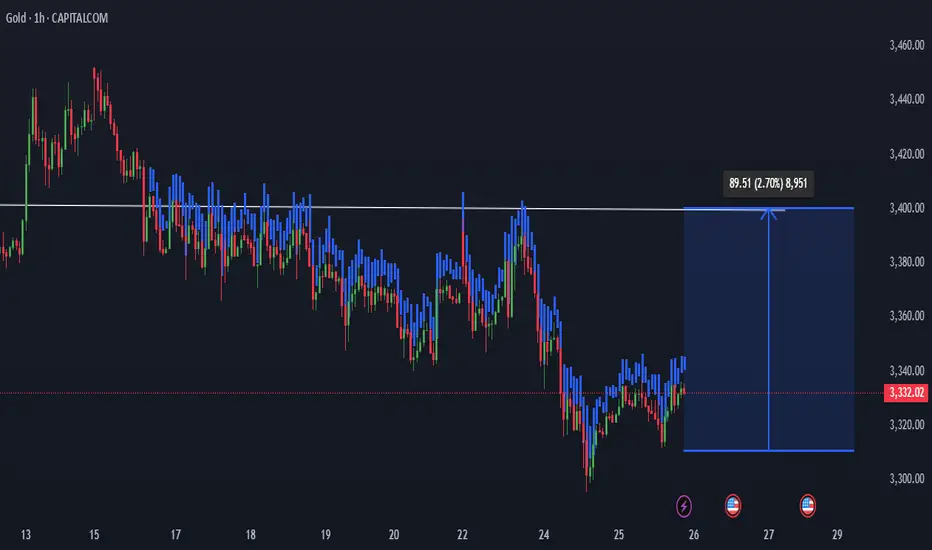
Current Price: ~$3,332
Resistance Level: ~3,400 (marked by the horizontal white line)
Potential Upside Target: Approximately 3,421
Expected Move: +89.51 points (+2.70%)
📈 Technical Interpretation:
Price Structure: After a recent downtrend, price appears to be forming a base and starting to bounce.
Bullish Breakout Potential: The blue shaded area suggests a bullish projection. If price breaks above the resistance (around 3,400), a move toward ~3,420+ is expected.
Volume Profile Overlay (Blue/Red Bars): Suggests historical volume concentration. Price might face resistance at the high-volume area (resistance line), but a breakout would signal strength.
✅ Bullish Scenario:
Entry Zone: Around current level (3,330–3,340), ideally on a breakout above 3,340.
Target: 3,420+
Risk: Breakdown below recent lows (~3,310–3,320) would invalidate the bullish idea
Feragatname
Bilgiler ve yayınlar, TradingView tarafından sağlanan veya onaylanan finansal, yatırım, işlem veya diğer türden tavsiye veya tavsiyeler anlamına gelmez ve teşkil etmez. Kullanım Şartları'nda daha fazlasını okuyun.
Feragatname
Bilgiler ve yayınlar, TradingView tarafından sağlanan veya onaylanan finansal, yatırım, işlem veya diğer türden tavsiye veya tavsiyeler anlamına gelmez ve teşkil etmez. Kullanım Şartları'nda daha fazlasını okuyun.