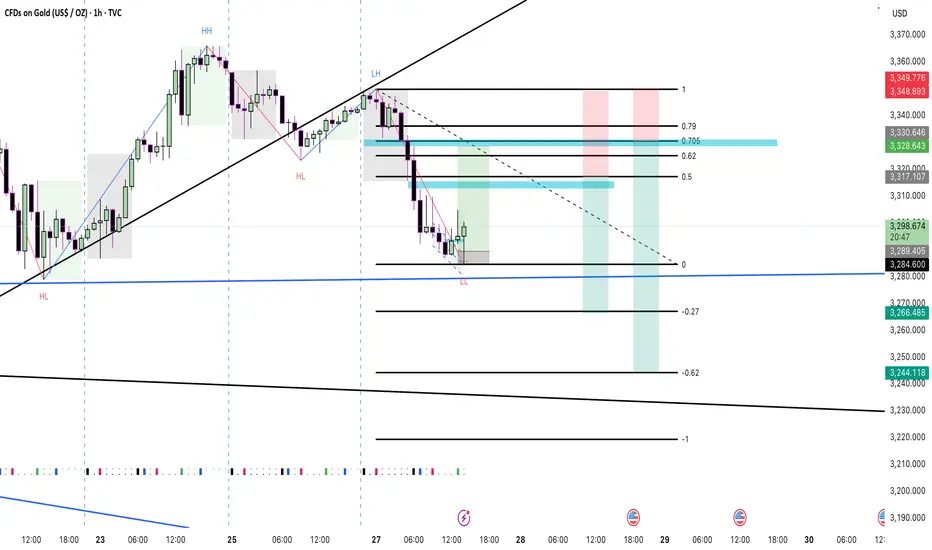
Here’s a concise mapping of my custom Fibonacci levels and how they fit into the structure we’ve been watching on the 1-hour gold chart:
Fib Level Your Label Notes / Significance
1.00 Start Swing-high anchor (≈ 3,298.7)
0.79 79% Retracement Deep pullback zone — often last resistance before full
retrace
0.705 OTE (Optimal Trade Entry)
70.5 “Sweet spot” for aggressive entries
0.62 62% Retracement Classical golden zone — nice confluence with trendline area
0.50 Equilibrium Midpoint of move — balance between bulls & bears
0.00 Profit Scale Swing-low anchor (≈ 3,284.4)
–0.27 Target 1 First extension target once 0 is broken
–0.62 Target 2 Second extension — deeper follow-through
–1.00 Symmetrical Price Mirror of the 1.0 level beyond 0
How to Use These Levels in Your Setup
Position Sizing Example: 1 lot (1,000 oz)
Entry Zones
Wait for price to retrace into your OTE (0.705) or 62% (0.62) area before considering longs.
A close above the minor downtrend line within this zone adds conviction.
Stops & Risk
Place stops just below 50% (0.5) or your swing-low (0.0), depending on how tight you want the trade.
Profit Targets
Partial exit around 0.0 (Profit Scale) if you’re scaling out.
Extended targets at –0.27 (Target 1) and –0.62 (Target 2) for full-size holds.
Alternative Short Setup
If price fails to break above 0.62–0.705 and shows reversal candles, you can flip to a short with the same targets (–0.27, –0.62) below 0.0.
Notice: This is paper-trading only, demonstrating technical analysis skills. It is not financial advice. Always do your own due diligence before trading.
Not
This setup is not Valid anymore. trade is overFeragatname
Bilgiler ve yayınlar, TradingView tarafından sağlanan veya onaylanan finansal, yatırım, işlem veya diğer türden tavsiye veya tavsiyeler anlamına gelmez ve teşkil etmez. Kullanım Şartları'nda daha fazlasını okuyun.
Feragatname
Bilgiler ve yayınlar, TradingView tarafından sağlanan veya onaylanan finansal, yatırım, işlem veya diğer türden tavsiye veya tavsiyeler anlamına gelmez ve teşkil etmez. Kullanım Şartları'nda daha fazlasını okuyun.
