Weekly Support & Resistance Levels
From EquityPandit (for the week August 25–29, 2025):
Immediate Resistance (R1): ₹ 2,111.90
Main Resistance (R2): ₹ 2,170.90
Max Resistance (R3): ₹ 2,249.90
Immediate Support (S1): ₹ 1,973.90
Major Support (S2): ₹ 1,894.90
Deep Support (S3): ₹ 1,835.90
Weekly Pivot Points (TopStockResearch):
Pivot Level: ₹ 2,032.90 (midpoint)
Weekly S1: ₹ 1,973.90
Weekly S2: ₹ 1,894.90
Weekly R1: ₹ 2,111.90
Weekly R2: ₹ 2,170.90
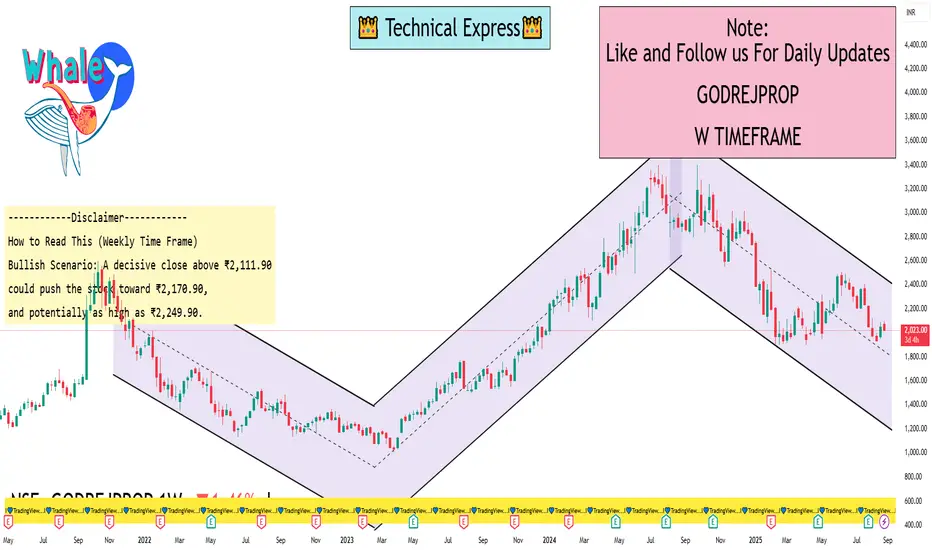
How to Read This (Weekly Time Frame)
Bullish Scenario: A decisive close above ₹2,111.90 could push the stock toward ₹2,170.90, and potentially as high as ₹2,249.90.
Bearish Scenario: A breakdown below ₹1,973.90 puts ₹1,894.90 and further down ₹1,835.90 into sharper focus.
Range-Bound: As long as the stock trades between roughly ₹1,974–₹2,112, it may remain in a consolidation phase.
From EquityPandit (for the week August 25–29, 2025):
Immediate Resistance (R1): ₹ 2,111.90
Main Resistance (R2): ₹ 2,170.90
Max Resistance (R3): ₹ 2,249.90
Immediate Support (S1): ₹ 1,973.90
Major Support (S2): ₹ 1,894.90
Deep Support (S3): ₹ 1,835.90
Weekly Pivot Points (TopStockResearch):
Pivot Level: ₹ 2,032.90 (midpoint)
Weekly S1: ₹ 1,973.90
Weekly S2: ₹ 1,894.90
Weekly R1: ₹ 2,111.90
Weekly R2: ₹ 2,170.90
How to Read This (Weekly Time Frame)
Bullish Scenario: A decisive close above ₹2,111.90 could push the stock toward ₹2,170.90, and potentially as high as ₹2,249.90.
Bearish Scenario: A breakdown below ₹1,973.90 puts ₹1,894.90 and further down ₹1,835.90 into sharper focus.
Range-Bound: As long as the stock trades between roughly ₹1,974–₹2,112, it may remain in a consolidation phase.
I built a Buy & Sell Signal Indicator with 85% accuracy.
📈 Get access via DM or
WhatsApp: wa.link/d997q0
Contact - +91 76782 40962
| Email: techncialexpress@gmail.com
| Script Coder | Trader | Investor | From India
📈 Get access via DM or
WhatsApp: wa.link/d997q0
Contact - +91 76782 40962
| Email: techncialexpress@gmail.com
| Script Coder | Trader | Investor | From India
İlgili yayınlar
Feragatname
Bilgiler ve yayınlar, TradingView tarafından sağlanan veya onaylanan finansal, yatırım, alım satım veya diğer türden tavsiye veya öneriler anlamına gelmez ve teşkil etmez. Kullanım Koşulları bölümünde daha fazlasını okuyun.