As of the close on Monday, May 19, 2025, Globus Spirits Ltd (NSE: GLOBUSSPR) traded at ₹1,104.40, reflecting a 1.62% increase from the previous session.
📊 Daily Technical Overview
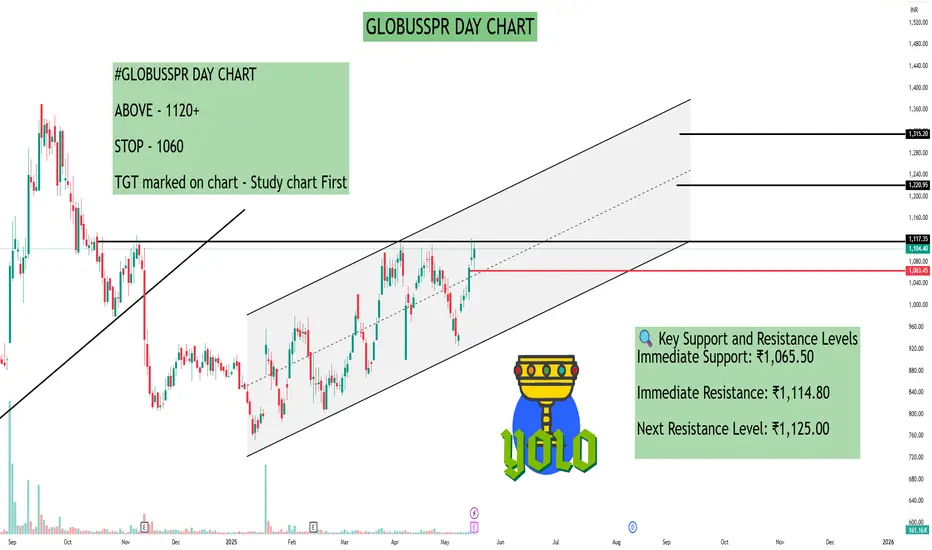
Price Action:
Day's Range: ₹1,065.50 – ₹1,114.80
52-Week Range: ₹670.00 – ₹1,369.75
Volume: 161,165 shares traded
Technical Indicators:
Relative Strength Index (RSI): 61.68 – indicating neutral to slightly bullish momentum.
Moving Average Convergence Divergence (MACD): 6.03 – suggesting a bullish crossover.
Average Directional Index (ADX): 15.29 – indicating a weak trend strength.
Stochastic Oscillator: 62.44 – pointing to neutral momentum.
Indicator: ₹957.02 – acting as a support level.
Parabolic SAR (PSAR): ₹927.02 – indicating an upward trend.
🔍 Key Support and Resistance Levels
Immediate Support: ₹1,065.50
Immediate Resistance: ₹1,114.80
Next Resistance Level: ₹1,125.00
📈 Outlook
The technical indicators suggest that Globus Spirits Ltd is experiencing a mild bullish trend. The RSI and MACD indicate positive momentum, while the ADX suggests that the trend strength is currently weak. If the stock maintains its position above the immediate support level of ₹1,065.50, it may attempt to break through the resistance at ₹1,114.80. A successful breakout could lead to testing the next resistance level at ₹1,125.00.
📊 Daily Technical Overview
Price Action:
Day's Range: ₹1,065.50 – ₹1,114.80
52-Week Range: ₹670.00 – ₹1,369.75
Volume: 161,165 shares traded
Technical Indicators:
Relative Strength Index (RSI): 61.68 – indicating neutral to slightly bullish momentum.
Moving Average Convergence Divergence (MACD): 6.03 – suggesting a bullish crossover.
Average Directional Index (ADX): 15.29 – indicating a weak trend strength.
Stochastic Oscillator: 62.44 – pointing to neutral momentum.
Indicator: ₹957.02 – acting as a support level.
Parabolic SAR (PSAR): ₹927.02 – indicating an upward trend.
🔍 Key Support and Resistance Levels
Immediate Support: ₹1,065.50
Immediate Resistance: ₹1,114.80
Next Resistance Level: ₹1,125.00
📈 Outlook
The technical indicators suggest that Globus Spirits Ltd is experiencing a mild bullish trend. The RSI and MACD indicate positive momentum, while the ADX suggests that the trend strength is currently weak. If the stock maintains its position above the immediate support level of ₹1,065.50, it may attempt to break through the resistance at ₹1,114.80. A successful breakout could lead to testing the next resistance level at ₹1,125.00.
I built a Buy & Sell Signal Indicator with 85% accuracy.
📈 Get access via DM or
WhatsApp: wa.link/d997q0
Contact - +91 76782 40962
| Email: techncialexpress@gmail.com
| Script Coder | Trader | Investor | From India
📈 Get access via DM or
WhatsApp: wa.link/d997q0
Contact - +91 76782 40962
| Email: techncialexpress@gmail.com
| Script Coder | Trader | Investor | From India
İlgili yayınlar
Feragatname
Bilgiler ve yayınlar, TradingView tarafından sağlanan veya onaylanan finansal, yatırım, alım satım veya diğer türden tavsiye veya öneriler anlamına gelmez ve teşkil etmez. Kullanım Koşulları bölümünde daha fazlasını okuyun.