I noticed confluence over on the GBPCHF pair. Here's the breakdown on the daily and H1 timeframes.
Daily Timeframe:
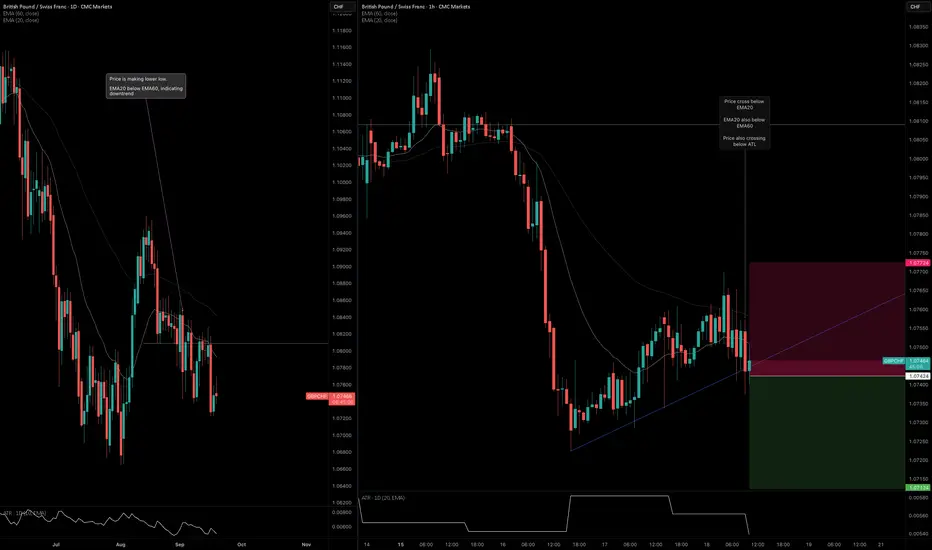
H1 Timeframe:
Daily Timeframe:
- EMA20 is below EMA60 > downtrend structure
- Price is also bouncing below EMA20 > confirms downtrend
- Price also holding below HTL based on previous end at bearish candle
H1 Timeframe:
- Price is exiting the EMA band > momentum has high potential to accelerate lower
- EMA20 is below EMA60 and expanding > confluence that momentum is accelerating
Feragatname
Bilgiler ve yayınlar, TradingView tarafından sağlanan veya onaylanan finansal, yatırım, alım satım veya diğer türden tavsiye veya öneriler anlamına gelmez ve teşkil etmez. Kullanım Koşulları bölümünde daha fazlasını okuyun.
Feragatname
Bilgiler ve yayınlar, TradingView tarafından sağlanan veya onaylanan finansal, yatırım, alım satım veya diğer türden tavsiye veya öneriler anlamına gelmez ve teşkil etmez. Kullanım Koşulları bölümünde daha fazlasını okuyun.