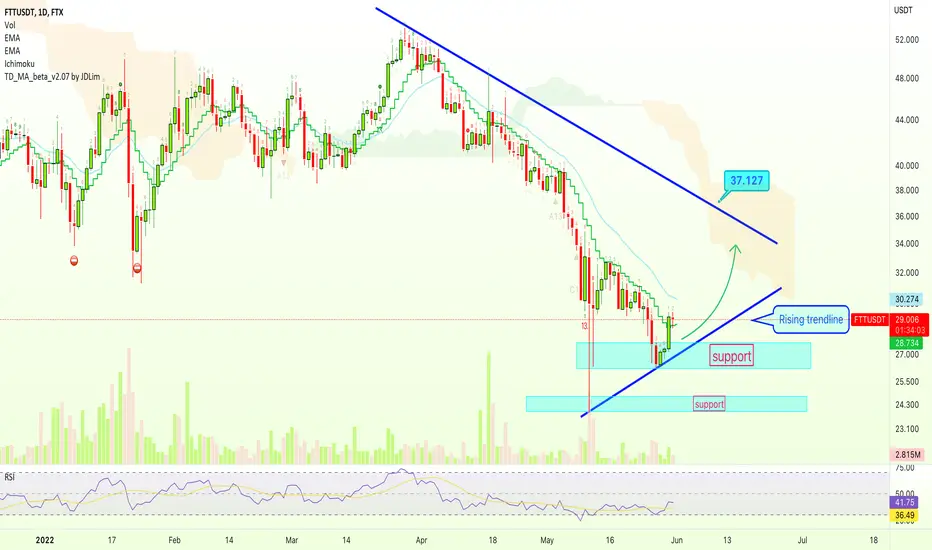
We can see that FTTUSDT (FTX Token) managed to break above EMA10 on negligible volume... Which isn't really good but, once we have a bounce start to develop, we can see the counter-trendline being challenge, this is mapped on the chart.
We stay bullish above the "rising trendline".
We turn/switch/adapt to bearish below "support".
We aim at $35-$37 as bullish target on the next jump.
Namaste.
We stay bullish above the "rising trendline".
We turn/switch/adapt to bearish below "support".
We aim at $35-$37 as bullish target on the next jump.
Namaste.
🚨 Get the FULL (6-in-1) PREMIUM PACKAGE
lamatrades.com —Since 2017
🚨 TOP Results: ZEC +2736% · ETH +2150%, CRO +1272%, AAVE +1134%, DOGS +868%, SOL +861%, XRP +749%, BTC +580%
More 👉 t.me/masteranandatrades/6681
lamatrades.com —Since 2017
🚨 TOP Results: ZEC +2736% · ETH +2150%, CRO +1272%, AAVE +1134%, DOGS +868%, SOL +861%, XRP +749%, BTC +580%
More 👉 t.me/masteranandatrades/6681
İlgili yayınlar
Feragatname
Bilgiler ve yayınlar, TradingView tarafından sağlanan veya onaylanan finansal, yatırım, alım satım veya diğer türden tavsiye veya öneriler anlamına gelmez ve teşkil etmez. Kullanım Koşulları bölümünde daha fazlasını okuyun.