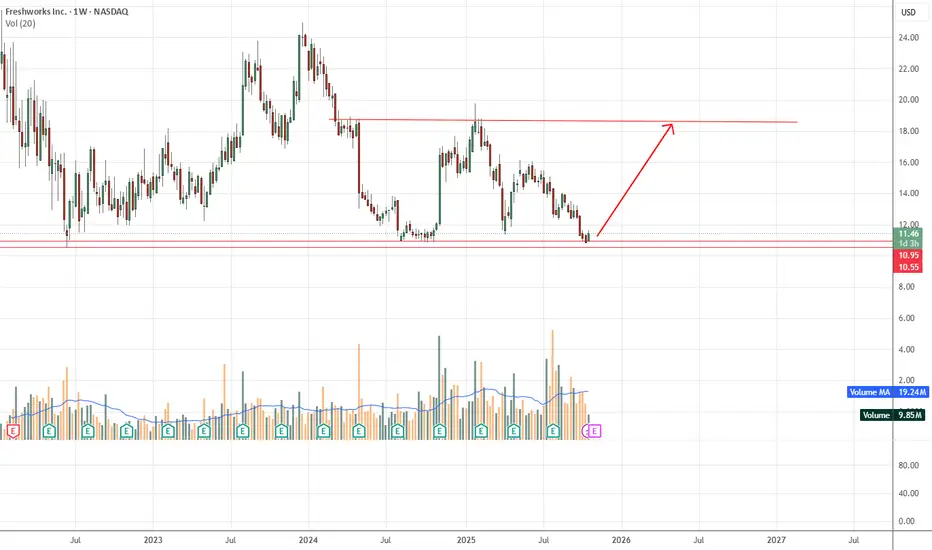
The stock is currently trading around $11.44, near its recent support zone at roughly $10.55–$10.95.
The chart shows a downtrend from previous highs, but price is testing a historically strong support level.
Resistance: Around $18 (where the upward arrow points), representing prior swing highs.
Bullish setup at current levels with clear risk/reward: low risk near support, high reward toward prior resistance.
Traders may look for confirmation (bullish candlestick, volume increase) before entering.
İşlem aktif
Feragatname
Bilgiler ve yayınlar, TradingView tarafından sağlanan veya onaylanan finansal, yatırım, alım satım veya diğer türden tavsiye veya öneriler anlamına gelmez ve teşkil etmez. Kullanım Koşulları bölümünde daha fazlasını okuyun.
Feragatname
Bilgiler ve yayınlar, TradingView tarafından sağlanan veya onaylanan finansal, yatırım, alım satım veya diğer türden tavsiye veya öneriler anlamına gelmez ve teşkil etmez. Kullanım Koşulları bölümünde daha fazlasını okuyun.