Technically we can say its reversal and BOSHello fellow traders,
This is a technical analysis of Exide Industries (NSE:EXIDEIND) on the daily timeframe. After a significant rally in 2023-2024, the stock has been in a corrective phase. My analysis suggests that we are now at a critical support level that could signal the end of this correction and the beginning of a new bullish impulse.
Here are the key factors pointing towards a potential reversal at the ₹380 - ₹390 zone:
1. Horizontal Support & Resistance Flip:
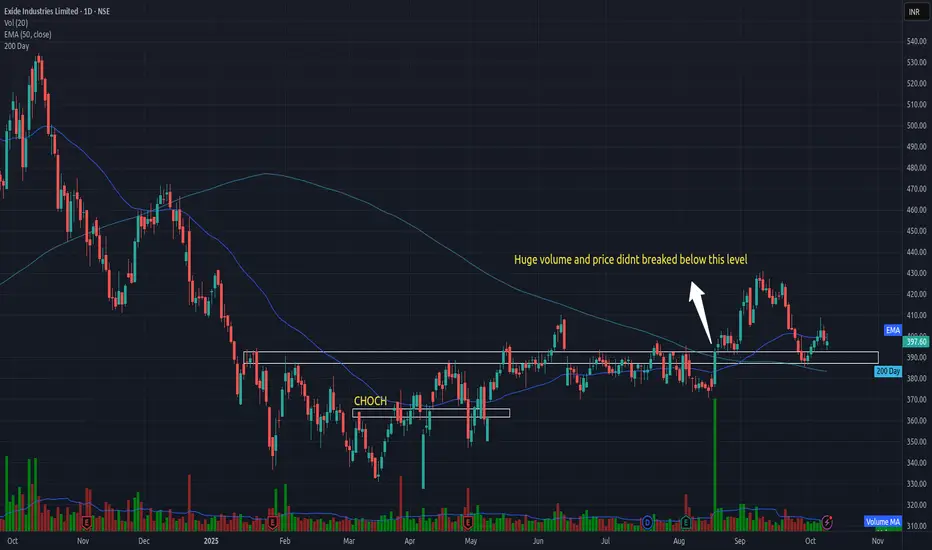
The ₹380 level acted as a strong resistance zone from February to August 2025. The price has now pulled back to this level, and it appears to be acting as strong support. This is a classic "resistance-turned-support" pattern, which is often a reliable indicator of strength.
2. Fibonacci Retracement Confluence:
Drawing a Fibonacci retracement from the major low in January 2023 to the high in July 2024, we can see that the current price is finding support directly at the 0.5 to 0.6 Fibonacci level (approximately ₹379). This is a key area where buyers often step back in during a pullback.
3. Significant Volume Rejection:
As highlighted on the chart, in late August/early September, there was a massive spike in volume as the price tested this support zone. Despite the high volume, the price failed to break down, and instead, it was aggressively bought up. This indicates strong institutional interest and absorption of selling pressure, validating the strength of this support.
4. Moving Average Support:
The price is currently consolidating around the 200-day moving average (200 DMA), a critical long-term trend indicator. Holding above the 200 EMA is a strong sign that the long-term uptrend is still intact.
Potential Scenarios
🐂 Bullish Case: If the price continues to hold above this confluence of support (₹380-390), the next logical targets would be the recent swing highs around ₹430, followed by higher resistance levels.
📉 Bearish Invalidation: This bullish idea would be invalidated if we see a decisive daily close below the ₹370 level. A break below this would negate the support structure and suggest a further move to the downside, potentially towards the 0.618 Fibonacci level.
Conclusion: The combination of strong horizontal structure, a key Fibonacci level, high volume rejection, and the 200 DMA makes the current price level a high-probability zone for a bullish reversal.
Disclaimer: This is for educational purposes only and is not financial advice. Please do your own research before making any trading decisions.
This is a technical analysis of Exide Industries (NSE:EXIDEIND) on the daily timeframe. After a significant rally in 2023-2024, the stock has been in a corrective phase. My analysis suggests that we are now at a critical support level that could signal the end of this correction and the beginning of a new bullish impulse.
Here are the key factors pointing towards a potential reversal at the ₹380 - ₹390 zone:
1. Horizontal Support & Resistance Flip:
The ₹380 level acted as a strong resistance zone from February to August 2025. The price has now pulled back to this level, and it appears to be acting as strong support. This is a classic "resistance-turned-support" pattern, which is often a reliable indicator of strength.
2. Fibonacci Retracement Confluence:
Drawing a Fibonacci retracement from the major low in January 2023 to the high in July 2024, we can see that the current price is finding support directly at the 0.5 to 0.6 Fibonacci level (approximately ₹379). This is a key area where buyers often step back in during a pullback.
3. Significant Volume Rejection:
As highlighted on the chart, in late August/early September, there was a massive spike in volume as the price tested this support zone. Despite the high volume, the price failed to break down, and instead, it was aggressively bought up. This indicates strong institutional interest and absorption of selling pressure, validating the strength of this support.
4. Moving Average Support:
The price is currently consolidating around the 200-day moving average (200 DMA), a critical long-term trend indicator. Holding above the 200 EMA is a strong sign that the long-term uptrend is still intact.
Potential Scenarios
🐂 Bullish Case: If the price continues to hold above this confluence of support (₹380-390), the next logical targets would be the recent swing highs around ₹430, followed by higher resistance levels.
📉 Bearish Invalidation: This bullish idea would be invalidated if we see a decisive daily close below the ₹370 level. A break below this would negate the support structure and suggest a further move to the downside, potentially towards the 0.618 Fibonacci level.
Conclusion: The combination of strong horizontal structure, a key Fibonacci level, high volume rejection, and the 200 DMA makes the current price level a high-probability zone for a bullish reversal.
Disclaimer: This is for educational purposes only and is not financial advice. Please do your own research before making any trading decisions.
Feragatname
Bilgiler ve yayınlar, TradingView tarafından sağlanan veya onaylanan finansal, yatırım, alım satım veya diğer türden tavsiye veya öneriler anlamına gelmez ve teşkil etmez. Kullanım Koşulları bölümünde daha fazlasını okuyun.
Feragatname
Bilgiler ve yayınlar, TradingView tarafından sağlanan veya onaylanan finansal, yatırım, alım satım veya diğer türden tavsiye veya öneriler anlamına gelmez ve teşkil etmez. Kullanım Koşulları bölümünde daha fazlasını okuyun.