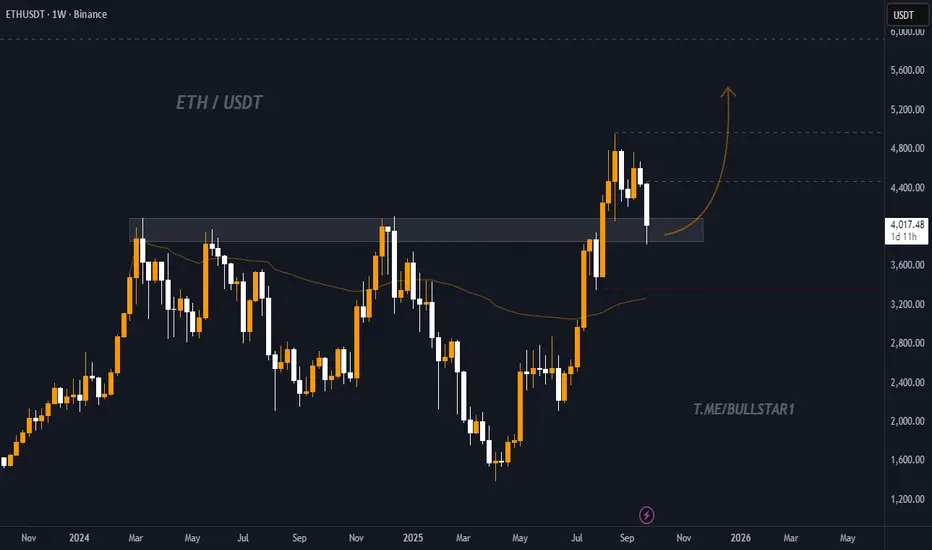
Ethereum (ETH) on the 1W chart has pulled back to a key resistance-turned-support zone around 3,800 – 4,000 USDT. This level also aligns with the 50-week moving average, creating a strong liquidity and demand area.
After a sharp rally towards 4,800 USDT, the price is currently correcting and consolidating above support. As long as this zone holds, a bullish continuation towards higher targets is expected.
🔑 Key Idea
As long as ETH holds above the 3,800 – 4,000 USDT zone, upside momentum remains valid.
A breakdown below this level would invalidate the mid-term bullish scenario.
📈 Targets:
Target 1: 4,400 USDT
Target 2: 4,800 USDT
Target 3: 5,200 USDT
⛔ Stop Loss:
Below 3,600 USDT to limit downside risk if support fails.
Feragatname
Bilgiler ve yayınlar, TradingView tarafından sağlanan veya onaylanan finansal, yatırım, işlem veya diğer türden tavsiye veya tavsiyeler anlamına gelmez ve teşkil etmez. Kullanım Şartları'nda daha fazlasını okuyun.
Feragatname
Bilgiler ve yayınlar, TradingView tarafından sağlanan veya onaylanan finansal, yatırım, işlem veya diğer türden tavsiye veya tavsiyeler anlamına gelmez ve teşkil etmez. Kullanım Şartları'nda daha fazlasını okuyun.