#Phase 1:
Impulse Wave (1–5) Completed
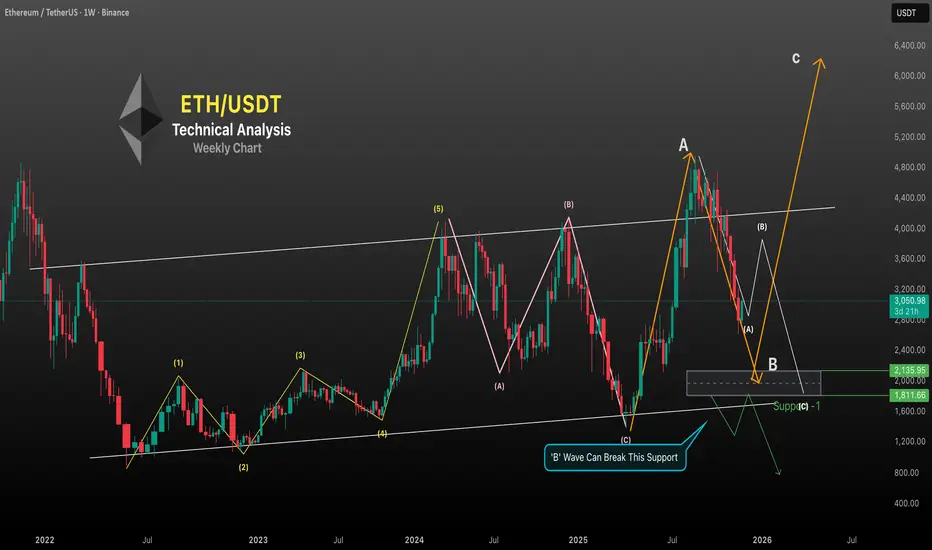
ETH completed a 5-wave impulsive structure from the 2022 lows to the 2024 top:
Wave (1) – Initial reversal from the bear market bottom
Wave (2) – Deep corrective pullback
Wave (3) – Strong expansion wave (typically the largest, as shown here)
Wave (4) – Sideways consolidation within the channel
Wave (5) – Final push into the upper resistance of the long-term channel
This 5-wave structure completed near the $4,093 region.
#Phase 2:
ABC Corrective Pattern Playing Out
After the 5-wave completion, ETH entered a large ABC correction:
(A) Wave
A sharp drop from the top, marking the start of correction.
(B) Wave
A lower-high retracement that couldn’t break above the multi-year channel resistance — classic sign of a corrective rally.
(C) Wave
This wave completed near the lower boundary of the long-term channel (shown on your chart), fulfilling the ABC structure.
#Phase 3:
New Cycle – Larger ABC Structure Forming
After completing the previous ABC cycle, ETH started a new higher-degree correction:
Wave A (up)
A strong rally to ~4,956 created the larger-degree Wave A.
Wave B (current)
Price is now declining in a steep Wave B structure.
Your highlighted grey demand zone ($1,800–$2,200) is the most likely B-wave target.
Notes Must Read
B-waves often break support briefly, creating a sentiment trap
#Phase 4:
Wave C – The Big Expansion (2026?)
After Wave B finishes inside $1,800–$2,200, ETH is likely to start a massive Wave C.
Wave C is typically:
Impulsive
Equal to Wave A or 1.618× Wave A
Target 🎯 $6,000 – $6,400 region
This matches the Elliott Wave rule where Wave C often extends strongly after a deep B-wave.
~Disclaimer~
High Risk Investment
Trading or investing in assets like crypto, equity, or commodities carries high risk and may not suit all investors.
Analysis on this channel uses recent technical data and market sentiment from web sources for informational and educational purposes only, not financial advice. Trading involves high risks, and past performance does not guarantee future results. Always conduct your own research or consult a SEBI-registered advisor before investing or trading.
This channel, Render With Me, is not responsible for any financial loss arising directly or indirectly from using or relying on this information.
renderwithme
Feragatname
Bilgiler ve yayınlar, TradingView tarafından sağlanan veya onaylanan finansal, yatırım, alım satım veya diğer türden tavsiye veya öneriler anlamına gelmez ve teşkil etmez. Kullanım Koşulları bölümünde daha fazlasını okuyun.
renderwithme
Feragatname
Bilgiler ve yayınlar, TradingView tarafından sağlanan veya onaylanan finansal, yatırım, alım satım veya diğer türden tavsiye veya öneriler anlamına gelmez ve teşkil etmez. Kullanım Koşulları bölümünde daha fazlasını okuyun.