Dear Traders,
Ethereum is currently in a corrective phase after a significant rally and repeated rejections from major resistance levels. The structure suggests price is approaching a critical zone that could determine ETH’s medium- to long-term direction.
Below is a full technical + fundamental + scenario-based analysis based on your chart.
🟦 1. Technical Analysis
🔹 Market Structure
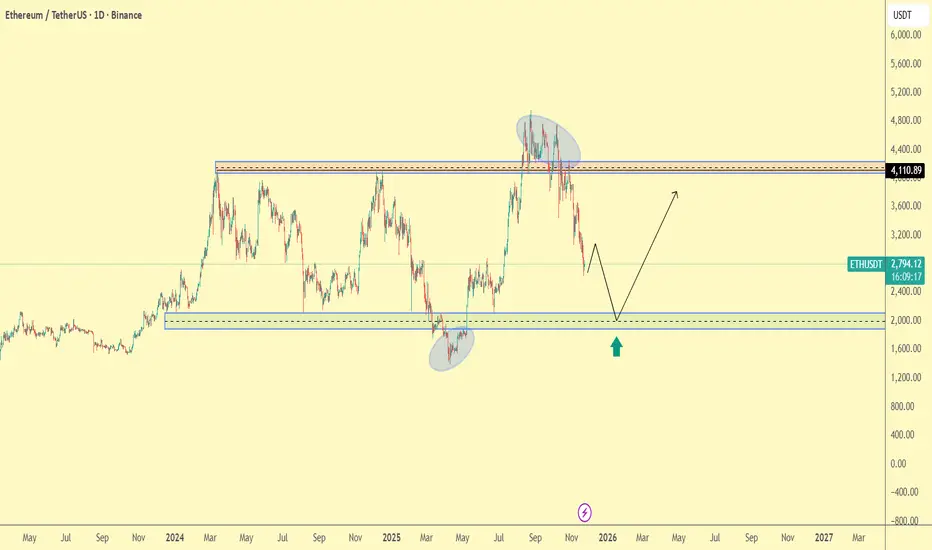
In the daily timeframe, Ethereum has rejected the major resistance area at $3,950 – $4,200, which previously acted as a local top. After failing to break above it twice, the market shifted into correction mode.
Price is now heading toward a major support zone around $1,890 – $2,150, which includes:
A strong historical demand zone
A previous accumulation area
A key horizontal support level
The region that initiated the previous uptrend
This is a macro support, tested multiple times.
🔹 Repeated Tops (Distribution Zones)
ETH formed two distribution structures around $4,100, indicating strong sell pressure.
Your marked ellipses correctly highlight areas where large players likely distributed positions.
🔹 Likely Path of Price
The chart structure suggests a high-probability scenario:
Retracement into $1,890–$2,150
Reaction or short-term bounce
Retest of broken structure or mid-range resistance
Potential start of a new upward leg
This follows the classic pattern: correction → accumulation → impulse.
🔹 Bullish Scenario
If Ethereum finds support and confirms reversal signals such as:
Bullish engulfing candles
Higher lows
Bullish BOS (Break of Structure)
RSI divergence
then a strong rally is likely.
Targets:
Target 1: $2,800 – $3,000
Target 2: ~$3,500
Target 3 (mid-term): $4,100 – $4,300
Breaking above $4,300 could open the door for a new long-term bullish cycle.
🔹 Bearish Scenario (Low Probability but Important)
If ETH loses the major support at $1,890 with strong volume:
Next support: $1,650
Deep correction target: $1,450
This scenario becomes more likely if Bitcoin enters a heavy sell-off or if macroeconomic risk increases.
🟦 2. Fundamental Analysis
Ethereum remains one of the strongest assets fundamentally, supported by real-world usage, developer activity, and network economics.
🔹 Network Upgrades (Ethereum Roadmap)
After the full transition to Proof-of-Stake and subsequent upgrades, Ethereum benefits from:
Lower issuance (near-deflationary supply)
Lower energy consumption
Higher performance
Better scalability
Upcoming improvements focus on data availability and rollup efficiency, which reduces gas fees and boosts ecosystem growth.
🔹 Growth of Layer 2 Networks
L2 ecosystems like:
Arbitrum
Optimism
Base
zkSync
Starknet
are driving massive transaction volume into Ethereum.
More L2 usage → more ETH burned → stronger long-term value.
🔹 Dominance in DeFi
Ethereum still leads the DeFi sector:
Highest TVL (Total Value Locked)
Most active protocols
Largest developer community
This creates continuous, organic demand for ETH in:
Transactions
Staking
Collateral
Smart contract execution
🔹 Staking Demand
Over 25% of Ethereum’s total supply is staked.
This reduces circulating supply, lowers sell pressure, and supports long-term price appreciation.
Institutional interest in staking continues to grow, further strengthening fundamentals.
🔹 Key Risks
Despite strong fundamentals, ETH faces these challenges:
Regulatory pressure on staking services
Correlation with Bitcoin in macro downtrends
Competition from fast L1 networks (Solana, Avalanche, Sui, etc.)
Still, Ethereum remains ahead in ecosystem maturity and security.
🟦 3. Final Summary
Ethereum is approaching one of its most important supports in the last two years.
If buyers defend the $1,890–$2,150 region, a multi-month bullish wave could begin.
🔥 Key Points
ETH is correcting into major support
Technical structure is still bullish in the bigger picture
Fundamentals remain extremely strong
L2 growth, staking, and DeFi support long-term appreciation
The main scenario is: correction → accumulation → upward continuation
Targets remain $3,000 → $3,500 → $4,300 if the support holds.
Ethereum is currently in a corrective phase after a significant rally and repeated rejections from major resistance levels. The structure suggests price is approaching a critical zone that could determine ETH’s medium- to long-term direction.
Below is a full technical + fundamental + scenario-based analysis based on your chart.
🟦 1. Technical Analysis
🔹 Market Structure
In the daily timeframe, Ethereum has rejected the major resistance area at $3,950 – $4,200, which previously acted as a local top. After failing to break above it twice, the market shifted into correction mode.
Price is now heading toward a major support zone around $1,890 – $2,150, which includes:
A strong historical demand zone
A previous accumulation area
A key horizontal support level
The region that initiated the previous uptrend
This is a macro support, tested multiple times.
🔹 Repeated Tops (Distribution Zones)
ETH formed two distribution structures around $4,100, indicating strong sell pressure.
Your marked ellipses correctly highlight areas where large players likely distributed positions.
🔹 Likely Path of Price
The chart structure suggests a high-probability scenario:
Retracement into $1,890–$2,150
Reaction or short-term bounce
Retest of broken structure or mid-range resistance
Potential start of a new upward leg
This follows the classic pattern: correction → accumulation → impulse.
🔹 Bullish Scenario
If Ethereum finds support and confirms reversal signals such as:
Bullish engulfing candles
Higher lows
Bullish BOS (Break of Structure)
RSI divergence
then a strong rally is likely.
Targets:
Target 1: $2,800 – $3,000
Target 2: ~$3,500
Target 3 (mid-term): $4,100 – $4,300
Breaking above $4,300 could open the door for a new long-term bullish cycle.
🔹 Bearish Scenario (Low Probability but Important)
If ETH loses the major support at $1,890 with strong volume:
Next support: $1,650
Deep correction target: $1,450
This scenario becomes more likely if Bitcoin enters a heavy sell-off or if macroeconomic risk increases.
🟦 2. Fundamental Analysis
Ethereum remains one of the strongest assets fundamentally, supported by real-world usage, developer activity, and network economics.
🔹 Network Upgrades (Ethereum Roadmap)
After the full transition to Proof-of-Stake and subsequent upgrades, Ethereum benefits from:
Lower issuance (near-deflationary supply)
Lower energy consumption
Higher performance
Better scalability
Upcoming improvements focus on data availability and rollup efficiency, which reduces gas fees and boosts ecosystem growth.
🔹 Growth of Layer 2 Networks
L2 ecosystems like:
Arbitrum
Optimism
Base
zkSync
Starknet
are driving massive transaction volume into Ethereum.
More L2 usage → more ETH burned → stronger long-term value.
🔹 Dominance in DeFi
Ethereum still leads the DeFi sector:
Highest TVL (Total Value Locked)
Most active protocols
Largest developer community
This creates continuous, organic demand for ETH in:
Transactions
Staking
Collateral
Smart contract execution
🔹 Staking Demand
Over 25% of Ethereum’s total supply is staked.
This reduces circulating supply, lowers sell pressure, and supports long-term price appreciation.
Institutional interest in staking continues to grow, further strengthening fundamentals.
🔹 Key Risks
Despite strong fundamentals, ETH faces these challenges:
Regulatory pressure on staking services
Correlation with Bitcoin in macro downtrends
Competition from fast L1 networks (Solana, Avalanche, Sui, etc.)
Still, Ethereum remains ahead in ecosystem maturity and security.
🟦 3. Final Summary
Ethereum is approaching one of its most important supports in the last two years.
If buyers defend the $1,890–$2,150 region, a multi-month bullish wave could begin.
🔥 Key Points
ETH is correcting into major support
Technical structure is still bullish in the bigger picture
Fundamentals remain extremely strong
L2 growth, staking, and DeFi support long-term appreciation
The main scenario is: correction → accumulation → upward continuation
Targets remain $3,000 → $3,500 → $4,300 if the support holds.
💰MY FREE FOREX CRYPTO SIGNALS TELEGRAM CHANNEL: : t.me/Alirezaktrade
Feragatname
Bilgiler ve yayınlar, TradingView tarafından sağlanan veya onaylanan finansal, yatırım, alım satım veya diğer türden tavsiye veya öneriler anlamına gelmez ve teşkil etmez. Kullanım Koşulları bölümünde daha fazlasını okuyun.