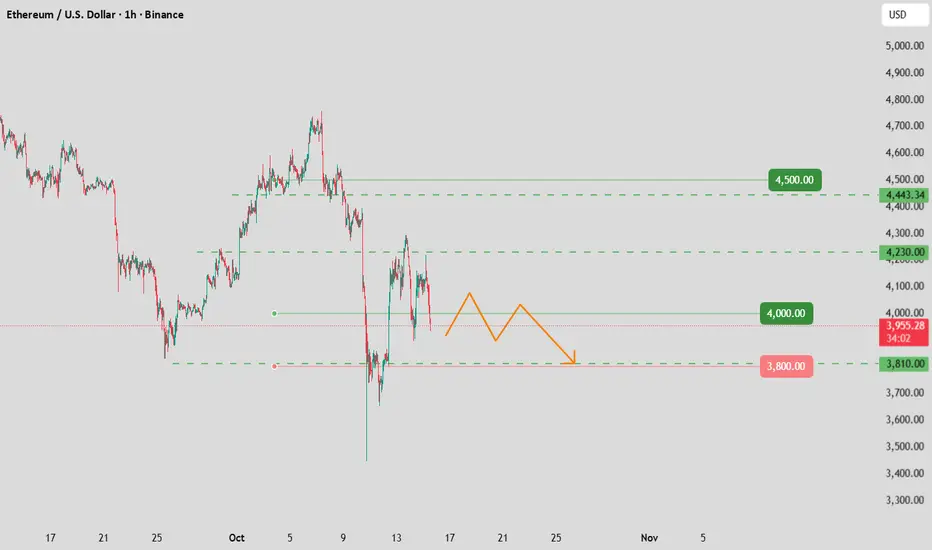
From a technical standpoint, Ethereum’s previous strong upward structure has been notably disrupted amid this pullback. The 1-hour K-line chart shows that after failing to break through the 4,788 high, ETH closed multiple consecutive long-bodied bearish candles. Its price has sequentially breached the MA5, MA20, and MA60 moving averages, marking a reversal in the short-term trend.
After the MACD indicator formed a "death cross" at a high level, the fast line has crossed below the zero line and entered the bearish zone. The green bearish momentum bars continue to expand, indicating that the short-term adjustment is not yet complete.
Today, Ethereum’s price is struggling to hold above the medium-term moving average. A break below this level could trigger a deeper decline.
Welcome to join my free channel for market updates: t.me/+EZspzjD8FT40YTY8
Daily update professional financial trading strategies: t.me/+6i-kmFunsMVkNzQ0
Let profitable trading become easier: t.me/+EZspzjD8FT40YTY8
Daily update professional financial trading strategies: t.me/+6i-kmFunsMVkNzQ0
Let profitable trading become easier: t.me/+EZspzjD8FT40YTY8
İlgili yayınlar
Feragatname
Bilgiler ve yayınlar, TradingView tarafından sağlanan veya onaylanan finansal, yatırım, işlem veya diğer türden tavsiye veya tavsiyeler anlamına gelmez ve teşkil etmez. Kullanım Şartları'nda daha fazlasını okuyun.