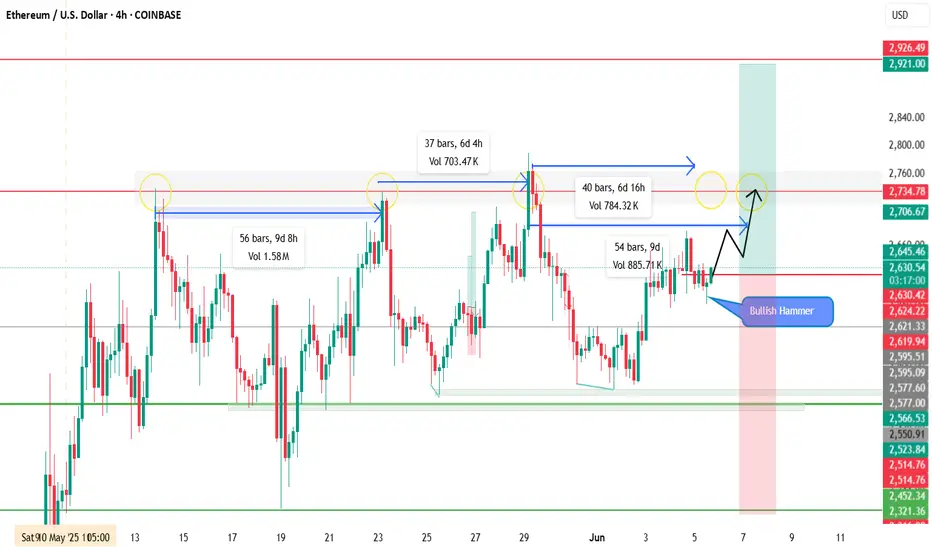
ETH is showing signs of a potential resistance retest, echoing previous price behavior. On the 4H chart, historical data suggests ETH typically revisits resistance zones within 6–9 days (±). The pair has been ranging between support and resistance, and a strong bullish hammer has just formed — signaling a potential shift in momentum.
📍 Entry: Market (Instant)
🛑 Stop Loss: 2312
🎯 Take Profit: 2913 (1:1 Risk-Reward)
📊 Plan: Trade aligned with historical timing and price structure. Entering on bullish confirmation.
⚠️ Note: Manage risk accordingly — structure looks promising, but always respect your stop.
📍 Entry: Market (Instant)
🛑 Stop Loss: 2312
🎯 Take Profit: 2913 (1:1 Risk-Reward)
📊 Plan: Trade aligned with historical timing and price structure. Entering on bullish confirmation.
⚠️ Note: Manage risk accordingly — structure looks promising, but always respect your stop.
Feragatname
Bilgiler ve yayınlar, TradingView tarafından sağlanan veya onaylanan finansal, yatırım, işlem veya diğer türden tavsiye veya tavsiyeler anlamına gelmez ve teşkil etmez. Kullanım Şartları'nda daha fazlasını okuyun.
Feragatname
Bilgiler ve yayınlar, TradingView tarafından sağlanan veya onaylanan finansal, yatırım, işlem veya diğer türden tavsiye veya tavsiyeler anlamına gelmez ve teşkil etmez. Kullanım Şartları'nda daha fazlasını okuyun.