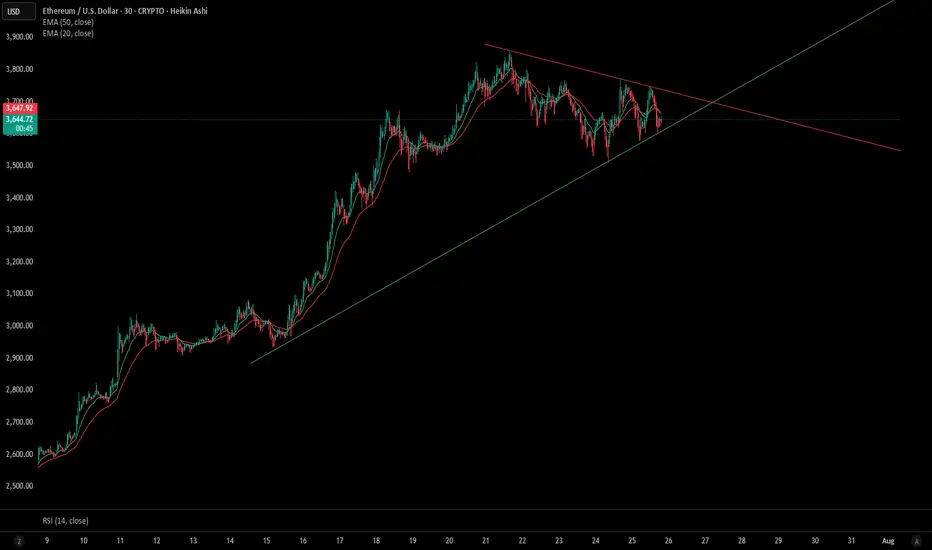
This 30-minute Heikin Ashi chart of Ethereum shows a developing symmetrical triangle pattern, signaling a potential breakout soon. Price action is consolidating between a rising trendline (support) and a descending trendline (resistance), converging near the $3,650 level.
EMAs: Price is currently trading between the 20 EMA ($3,662.61) and 50 EMA ($3,668.01), indicating indecision and tightening volatility.
RSI (14): Neutral at ~47, providing no strong directional bias.
Structure: Higher lows and lower highs define the triangle boundaries.
A breakout above $3,670–$3,700 could signal bullish continuation, while a break below $3,620 may trigger a bearish move.
Keep an eye on volume and RSI divergence to confirm breakout direction. Ideal for short-term traders anticipating a volatility spike.
Feragatname
Bilgiler ve yayınlar, TradingView tarafından sağlanan veya onaylanan finansal, yatırım, alım satım veya diğer türden tavsiye veya öneriler anlamına gelmez ve teşkil etmez. Kullanım Koşulları bölümünde daha fazlasını okuyun.
Feragatname
Bilgiler ve yayınlar, TradingView tarafından sağlanan veya onaylanan finansal, yatırım, alım satım veya diğer türden tavsiye veya öneriler anlamına gelmez ve teşkil etmez. Kullanım Koşulları bölümünde daha fazlasını okuyun.