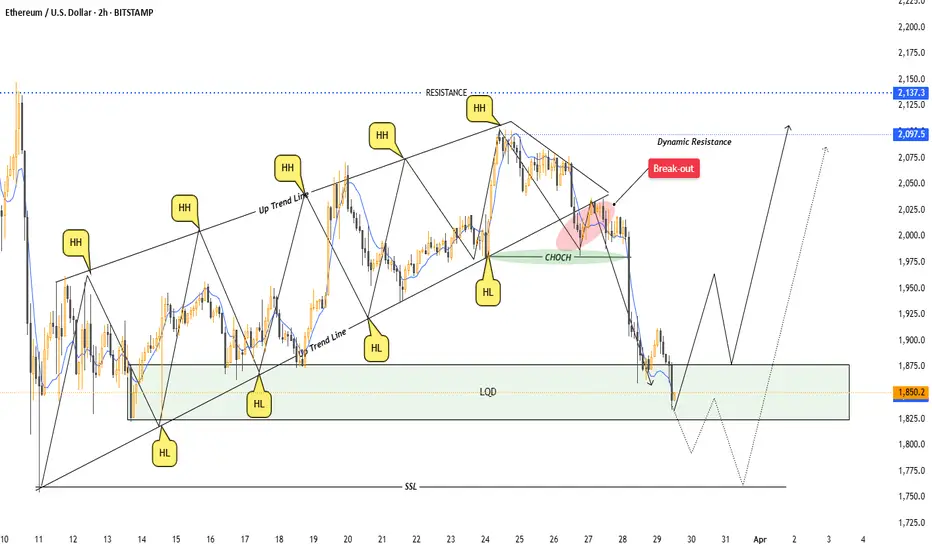
### * ETHUSD 2-hour time frame chart analysis".
#### *Tools Used:*
1. *Trend Lines:*
- An *uptrend channel* is drawn using two parallel trend lines, connecting *higher highs (HH) and higher lows (HL)*.
- A *breakout from the trendline* is marked, indicating a possible reversal.
2. *Labels & Annotations:*
- *HH (Higher Highs) and HL (Higher Lows)* are labeled to define the previous bullish structure.
- *CHOCH (Change of Character)* is highlighted, marking a shift in market direction.
- *Breakout Zone* is marked in red, indicating where price broke the trendline.
- *Dynamic Resistance* is labeled, suggesting a key level where price may face rejection.
3. *Liquidity Zone (LQD):*
- A *rectangular box (gray shaded area)* highlights a liquidity zone around 1,825–1,875 USD.
- This zone represents potential support where buyers may step in.
4. *Price Projection Paths:*
- Two *potential price movement paths* are drawn using curved lines.
- One suggests a bounce from the liquidity zone into an uptrend.
- The other suggests further consolidation before a breakout.
---
#### *Patterns Identified:*
1. *Uptrend Channel (Higher Highs and Higher Lows)*
- Before the breakout, the price followed a clear *higher highs (HH) and higher lows (HL) structure*.
2. *Change of Character (CHOCH)*
- Marked in blue, indicating a possible *trend reversal from bullish to bearish*.
3. *Breakout & Retest Pattern*
- The price *broke below the trendline*, confirming bearish momentum.
- A *potential retest* of the previous support (now resistance) may occur.
4. *Support & Resistance Levels:*
- *Resistance:* Marked near *2,125 - 2,150 USD*, a key level where price might struggle.
- *Support (Liquidity Zone):* Around *1,825 - 1,875 USD*, where buyers might step in.
### *Conclusion:*
This chart uses *trend lines, market structure analysis, breakout patterns, liquidity zones, and price projections* to predict potential future price movements. It suggests that the market is at a key decision point, where it could either bounce from support or continue downward before a reversal
Join Telegram Channel Free t.me/+lvC6DGTZAqk3NTI8 "Explore daily insights: 4/5 signals meticulously analyzed, ensuring an impressive 99% accuracy in forex & crypto trades t.me/+XHUwVU1EKek0Nzlk
Feragatname
Bilgiler ve yayınlar, TradingView tarafından sağlanan veya onaylanan finansal, yatırım, işlem veya diğer türden tavsiye veya tavsiyeler anlamına gelmez ve teşkil etmez. Kullanım Şartları'nda daha fazlasını okuyun.
