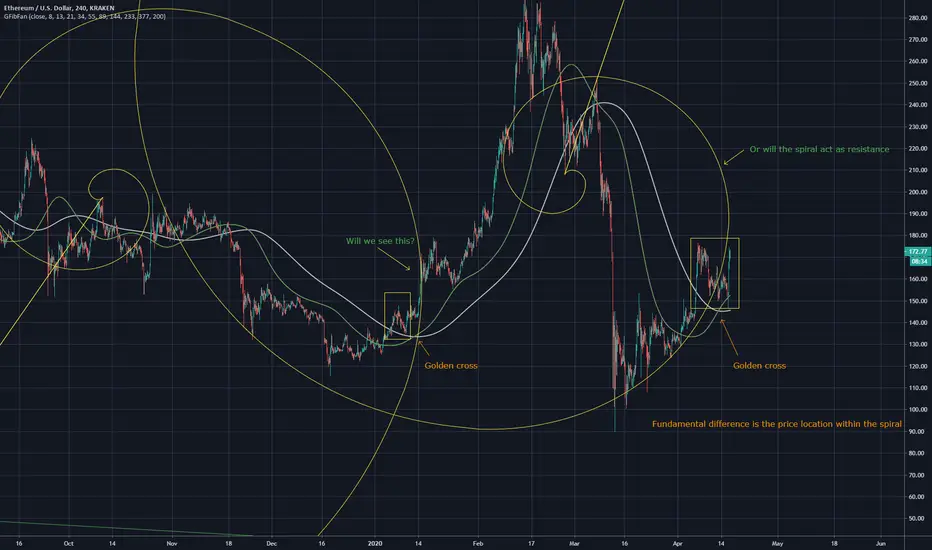
Comparison of two similar points on Ethereum
The previous golden cross produced a run that was on the INSIDE of the fibonacci spiral
While this golden cross is on the outside of the fib spiral, will this repeat? Or will it act as a resistance

Here is my bottoms chart for Ethereum showing bottom points and potential future bottoms
The previous golden cross produced a run that was on the INSIDE of the fibonacci spiral
While this golden cross is on the outside of the fib spiral, will this repeat? Or will it act as a resistance
Here is my bottoms chart for Ethereum showing bottom points and potential future bottoms
Feragatname
Bilgiler ve yayınlar, TradingView tarafından sağlanan veya onaylanan finansal, yatırım, alım satım veya diğer türden tavsiye veya öneriler anlamına gelmez ve teşkil etmez. Kullanım Koşulları bölümünde daha fazlasını okuyun.
Feragatname
Bilgiler ve yayınlar, TradingView tarafından sağlanan veya onaylanan finansal, yatırım, alım satım veya diğer türden tavsiye veya öneriler anlamına gelmez ve teşkil etmez. Kullanım Koşulları bölümünde daha fazlasını okuyun.