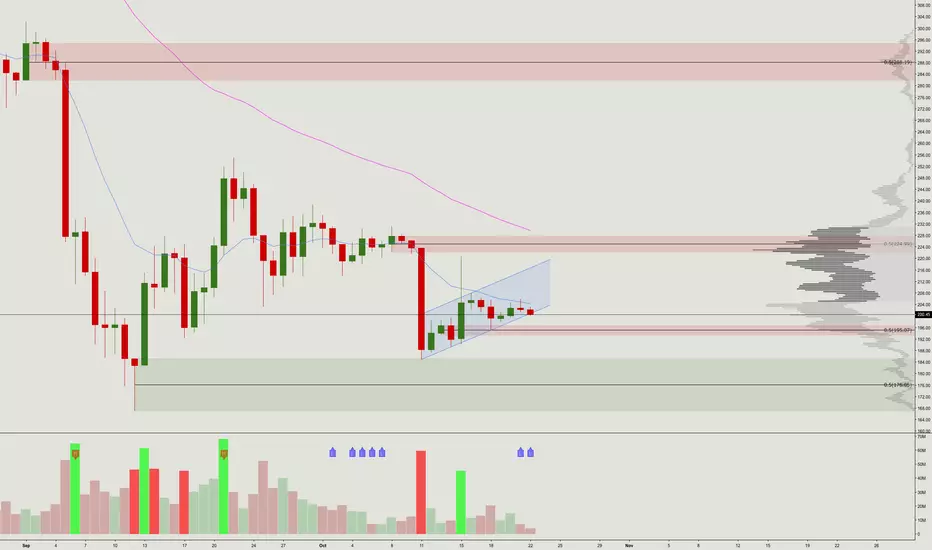
Ethereum continues to range in lockstep with Bitcoin PA but we seem to be forming a possible bearflag since dropping down to the top of the demand block.
We have trended upwards since the drop and volume has been on the decline besides that spike up last Monday as we dangle from the bottom support trendline at the moment.
The projection for a breakdown here would be a little lower from the bottom of this demand block around $165. Both EMAs continue to trend lower as the fast-moving EMA remains strong resistance.
Something to watch as a new low in Ethereum could itself cause lots of selling in altcoins and maybe even drag down Bitcoin but its way too early to tell, just something to keep an eye on.
Thanks guys
Feragatname
Bilgiler ve yayınlar, TradingView tarafından sağlanan veya onaylanan finansal, yatırım, işlem veya diğer türden tavsiye veya tavsiyeler anlamına gelmez ve teşkil etmez. Kullanım Şartları'nda daha fazlasını okuyun.
Feragatname
Bilgiler ve yayınlar, TradingView tarafından sağlanan veya onaylanan finansal, yatırım, işlem veya diğer türden tavsiye veya tavsiyeler anlamına gelmez ve teşkil etmez. Kullanım Şartları'nda daha fazlasını okuyun.