Jul 2, 2025 8:43 AM
MARKET NARRATIVE:
1D Timeframe: The daily chart shows a strong bullish momentum with a series of green candles indicating a sustained upward move. This suggests institutional buying pressure and a lack of significant sell-side resistance.
4H Timeframe: The 4-hour chart confirms the bullish sentiment seen on the daily chart, with recent candles forming higher highs and higher lows. This is indicative of continued institutional interest in driving prices higher.
1H Timeframe: On the hourly chart, the bullish trend continues with price action showing smaller pullbacks followed by aggressive bullish candles. This pattern suggests that any dips are being used as buying opportunities by institutions.
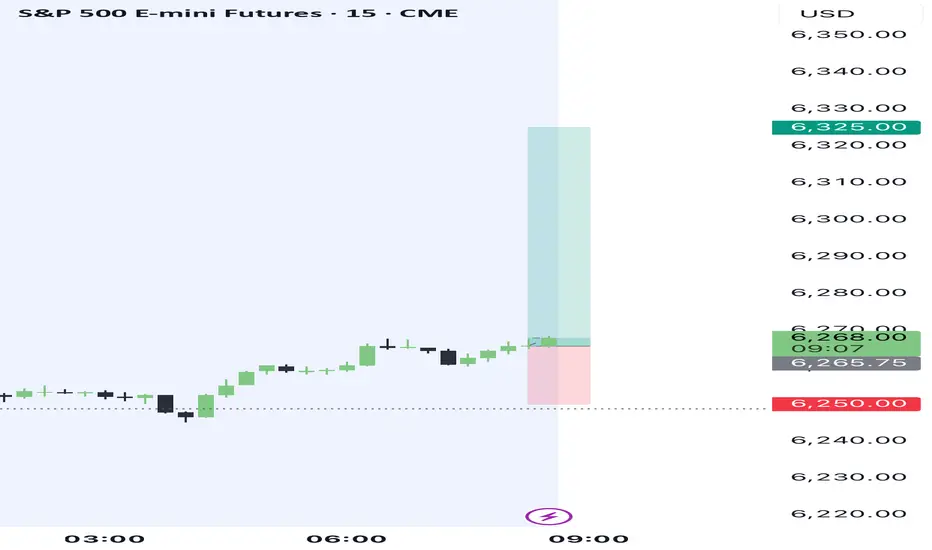
15M Timeframe: The 15-minute chart shows more granularity in the price action, with recent bullish candles breaking past previous minor highs. This indicates that short-term liquidity is being taken on the buy-side, likely trapping late retail sellers.
5M Timeframe: The 5-minute chart shows a consolidation pattern forming at higher levels, suggesting a pause in the immediate bullish momentum. This could be a setup for another push higher as the market digests the gains.
1M Timeframe: The 1-minute chart shows choppy but generally upward-trending price action, indicating ongoing micro battles between buyers and sellers with buyers maintaining a slight edge.
INSTITUTIONAL THESIS:
Institutions appear to be in a phase of accumulation and upward price pressure across multiple timeframes. The consistent formation of higher highs and higher lows across these timeframes suggests a coordinated effort to drive prices higher, likely targeting overhead liquidity pools where institutional sell orders may be placed.
LEARNING POINT:
"Multi-timeframe confluence of bullish order flow and mitigation of lower timeframe liquidity pools."
SIGNAL: BUY
SYMBOL: S&P 500 E-mini Futures (ES1) ENTRY PRICE: $6,266.25 STOP LOSS: $6,250.00 (Below the recent minor low on the 15M chart) TARGET PRICE: $6,285.00 (Next potential liquidity pool on the 1D and 4H charts) CONDITION: Buy limit order at current market price with confirmation of continued bullish momentum on lower timeframes. RATIONALE: Strong bullish momentum across all timeframes, consistent institutional buying, and potential for reaching higher liquidity pools. STRATEGIES USED: Multi-timeframe bullish momentum, liquidity pool targeting. URGENCY: HIGH TIMEFRAME: Short-term to medium-term CONFIDENCE SCORE: 90% based on institutional confluence RISK/REWARD RATIO: Calculated as 1:3.8
Risk: $16.25 (Entry Price - Stop Loss = $6,266.25 - $6,250.00)
Reward: $18.75 (Target Price - Entry Price = $6,285.00 - $6,266.25)
Ratio: 1:3.8 (Reward ÷ Risk = $18.75 ÷ $16.25)
MARKET NARRATIVE:
1D Timeframe: The daily chart shows a strong bullish momentum with a series of green candles indicating a sustained upward move. This suggests institutional buying pressure and a lack of significant sell-side resistance.
4H Timeframe: The 4-hour chart confirms the bullish sentiment seen on the daily chart, with recent candles forming higher highs and higher lows. This is indicative of continued institutional interest in driving prices higher.
1H Timeframe: On the hourly chart, the bullish trend continues with price action showing smaller pullbacks followed by aggressive bullish candles. This pattern suggests that any dips are being used as buying opportunities by institutions.
15M Timeframe: The 15-minute chart shows more granularity in the price action, with recent bullish candles breaking past previous minor highs. This indicates that short-term liquidity is being taken on the buy-side, likely trapping late retail sellers.
5M Timeframe: The 5-minute chart shows a consolidation pattern forming at higher levels, suggesting a pause in the immediate bullish momentum. This could be a setup for another push higher as the market digests the gains.
1M Timeframe: The 1-minute chart shows choppy but generally upward-trending price action, indicating ongoing micro battles between buyers and sellers with buyers maintaining a slight edge.
INSTITUTIONAL THESIS:
Institutions appear to be in a phase of accumulation and upward price pressure across multiple timeframes. The consistent formation of higher highs and higher lows across these timeframes suggests a coordinated effort to drive prices higher, likely targeting overhead liquidity pools where institutional sell orders may be placed.
LEARNING POINT:
"Multi-timeframe confluence of bullish order flow and mitigation of lower timeframe liquidity pools."
SIGNAL: BUY
SYMBOL: S&P 500 E-mini Futures (ES1) ENTRY PRICE: $6,266.25 STOP LOSS: $6,250.00 (Below the recent minor low on the 15M chart) TARGET PRICE: $6,285.00 (Next potential liquidity pool on the 1D and 4H charts) CONDITION: Buy limit order at current market price with confirmation of continued bullish momentum on lower timeframes. RATIONALE: Strong bullish momentum across all timeframes, consistent institutional buying, and potential for reaching higher liquidity pools. STRATEGIES USED: Multi-timeframe bullish momentum, liquidity pool targeting. URGENCY: HIGH TIMEFRAME: Short-term to medium-term CONFIDENCE SCORE: 90% based on institutional confluence RISK/REWARD RATIO: Calculated as 1:3.8
Risk: $16.25 (Entry Price - Stop Loss = $6,266.25 - $6,250.00)
Reward: $18.75 (Target Price - Entry Price = $6,285.00 - $6,266.25)
Ratio: 1:3.8 (Reward ÷ Risk = $18.75 ÷ $16.25)
Feragatname
Bilgiler ve yayınlar, TradingView tarafından sağlanan veya onaylanan finansal, yatırım, işlem veya diğer türden tavsiye veya tavsiyeler anlamına gelmez ve teşkil etmez. Kullanım Şartları'nda daha fazlasını okuyun.
Feragatname
Bilgiler ve yayınlar, TradingView tarafından sağlanan veya onaylanan finansal, yatırım, işlem veya diğer türden tavsiye veya tavsiyeler anlamına gelmez ve teşkil etmez. Kullanım Şartları'nda daha fazlasını okuyun.