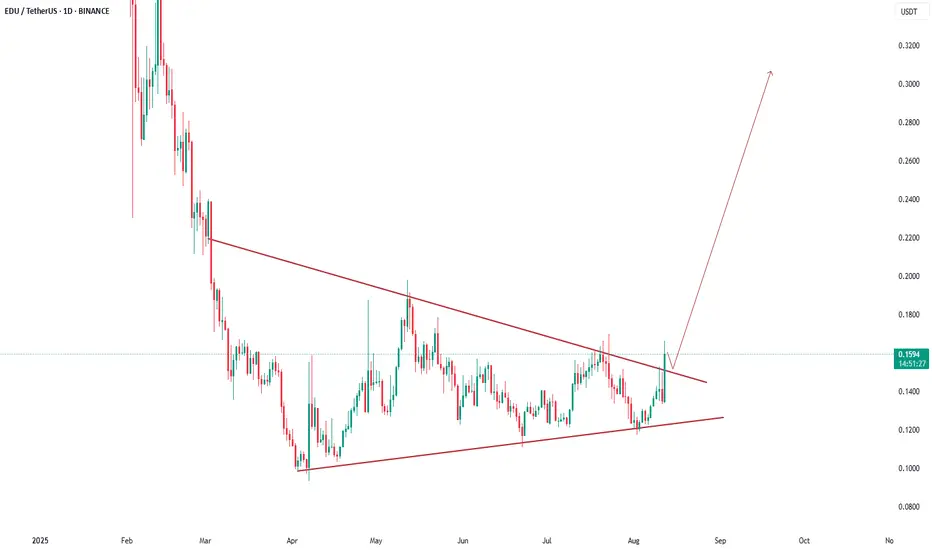
The daily chart for EDU/USDT on Binance shows a breakout above a long-term symmetrical triangle pattern after months of consolidation. Price has surged by over 18% today, supported by strong volume, signaling bullish momentum. If the breakout holds, the chart projection suggests a potential rally toward the $0.30 zone. Traders may watch for retests of the breakout line as possible support before continuation.
This is general information only and not financial advice. For personal guidance, please talk to a licensed professional.
This is general information only and not financial advice. For personal guidance, please talk to a licensed professional.
Feragatname
Bilgiler ve yayınlar, TradingView tarafından sağlanan veya onaylanan finansal, yatırım, alım satım veya diğer türden tavsiye veya öneriler anlamına gelmez ve teşkil etmez. Kullanım Koşulları bölümünde daha fazlasını okuyun.
Feragatname
Bilgiler ve yayınlar, TradingView tarafından sağlanan veya onaylanan finansal, yatırım, alım satım veya diğer türden tavsiye veya öneriler anlamına gelmez ve teşkil etmez. Kullanım Koşulları bölümünde daha fazlasını okuyun.