✨ Comprehensive and Engaging Technical Analysis:
DYDX/USDT is entering a highly compelling technical phase, showing signs of a potential trend reversal after breaking out from a prolonged accumulation zone that lasted nearly 5 months. This breakout on the daily timeframe (1D) is a classic early signal for a major upward move — often favored by swing traders and mid-term investors.
🔍 Accumulation Zone & Fibonacci Golden Pocket
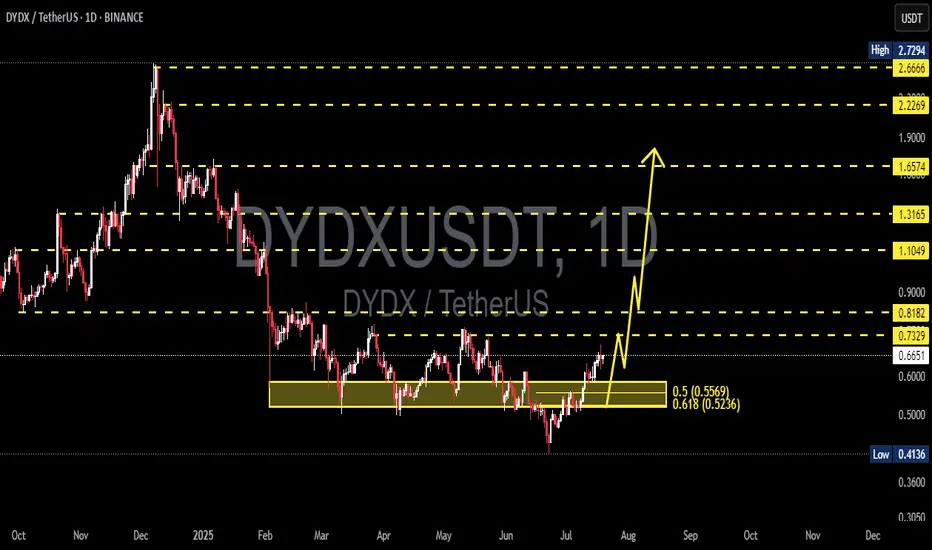
The range between $0.52 and $0.56 represents the Fibonacci retracement levels of 0.5 and 0.618 — commonly referred to as the "golden pocket".
This area historically acts as a strong accumulation zone, where institutional players often enter the market.
Multiple rejections and support confirmations within this zone reinforce its significance.
📈 Structure Breakout:
DYDX has officially broken above the horizontal structure near $0.6566 and further confirmed momentum beyond $0.7329.
The price action is forming a Double Bottom Pattern and potentially an Inverted Head & Shoulders, both of which are high-conviction bullish reversal patterns.
✅ Bullish Scenario (Primary Bias):
As long as DYDX holds above the $0.66–$0.73 breakout range, it remains on track for a significant bullish impulse. Key upside targets include:
Target (Resistance) Significance
$0.8182 Minor horizontal resistance
$1.1049 Key level from prior supply zone
$1.3165 Previous major reaction area
$1.6574 Multi-timeframe major resistance
$2.2269 – $2.6666 Fibonacci extension & historical distribution zone
$2.7294 Previous all-time high
💡 This structure offers a potential upside of over +200% if fully played out.
❗ Bearish Scenario (Alternative):
A failed retest and drop below $0.6566 would suggest a false breakout.
A breakdown below $0.52 would invalidate the bullish setup and could send DYDX back to $0.41, its previous macro support.
In this case, the market may re-enter a range-bound or sideways phase.
⚙️ Conclusion & Trading Strategy:
DYDX/USDT is at a technically critical moment. The recent breakout could mark the beginning of a major reversal trend after months of consolidation. A healthy pullback to the $0.66–$0.73 zone could offer an ideal entry opportunity with tight stop-losses.
For swing traders and trend followers, this may be one of the best risk/reward setups on DYDX in recent months.
#DYDXUSDT #DYDXBreakout #CryptoBullish #AltcoinSeason #CryptoAnalysis #FibonacciLevels #SmartMoney #DYDXRally #TechnicalBreakout
DYDX/USDT is entering a highly compelling technical phase, showing signs of a potential trend reversal after breaking out from a prolonged accumulation zone that lasted nearly 5 months. This breakout on the daily timeframe (1D) is a classic early signal for a major upward move — often favored by swing traders and mid-term investors.
🔍 Accumulation Zone & Fibonacci Golden Pocket
The range between $0.52 and $0.56 represents the Fibonacci retracement levels of 0.5 and 0.618 — commonly referred to as the "golden pocket".
This area historically acts as a strong accumulation zone, where institutional players often enter the market.
Multiple rejections and support confirmations within this zone reinforce its significance.
📈 Structure Breakout:
DYDX has officially broken above the horizontal structure near $0.6566 and further confirmed momentum beyond $0.7329.
The price action is forming a Double Bottom Pattern and potentially an Inverted Head & Shoulders, both of which are high-conviction bullish reversal patterns.
✅ Bullish Scenario (Primary Bias):
As long as DYDX holds above the $0.66–$0.73 breakout range, it remains on track for a significant bullish impulse. Key upside targets include:
Target (Resistance) Significance
$0.8182 Minor horizontal resistance
$1.1049 Key level from prior supply zone
$1.3165 Previous major reaction area
$1.6574 Multi-timeframe major resistance
$2.2269 – $2.6666 Fibonacci extension & historical distribution zone
$2.7294 Previous all-time high
💡 This structure offers a potential upside of over +200% if fully played out.
❗ Bearish Scenario (Alternative):
A failed retest and drop below $0.6566 would suggest a false breakout.
A breakdown below $0.52 would invalidate the bullish setup and could send DYDX back to $0.41, its previous macro support.
In this case, the market may re-enter a range-bound or sideways phase.
⚙️ Conclusion & Trading Strategy:
DYDX/USDT is at a technically critical moment. The recent breakout could mark the beginning of a major reversal trend after months of consolidation. A healthy pullback to the $0.66–$0.73 zone could offer an ideal entry opportunity with tight stop-losses.
For swing traders and trend followers, this may be one of the best risk/reward setups on DYDX in recent months.
#DYDXUSDT #DYDXBreakout #CryptoBullish #AltcoinSeason #CryptoAnalysis #FibonacciLevels #SmartMoney #DYDXRally #TechnicalBreakout
✅ Get Free Signals! Join Our Telegram Channel Here: t.me/TheCryptoNuclear
✅ Twitter: twitter.com/crypto_nuclear
✅ Join Bybit : partner.bybit.com/b/nuclearvip
✅ Benefits : Lifetime Trading Fee Discount -50%
✅ Twitter: twitter.com/crypto_nuclear
✅ Join Bybit : partner.bybit.com/b/nuclearvip
✅ Benefits : Lifetime Trading Fee Discount -50%
Feragatname
Bilgiler ve yayınlar, TradingView tarafından sağlanan veya onaylanan finansal, yatırım, işlem veya diğer türden tavsiye veya tavsiyeler anlamına gelmez ve teşkil etmez. Kullanım Şartları'nda daha fazlasını okuyun.