📊 DXY Technical Outlook 💵
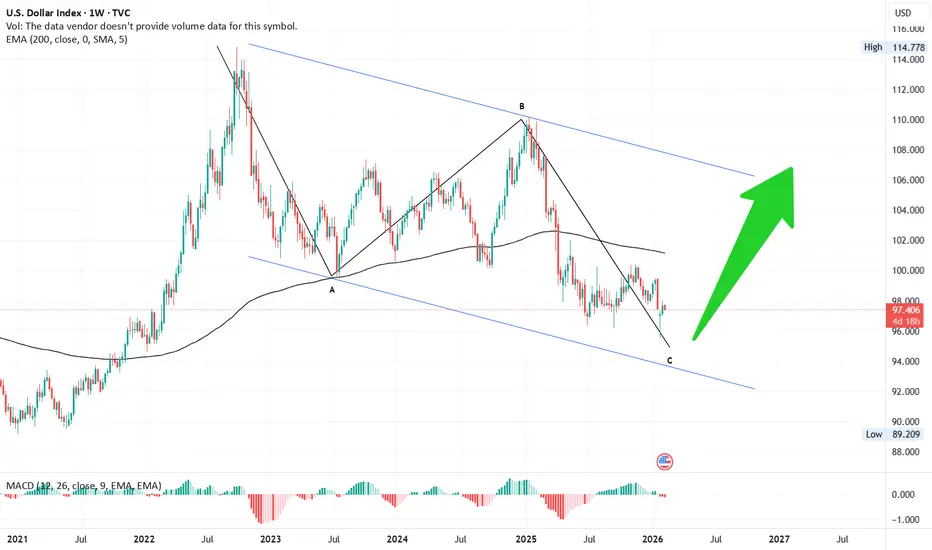
On 26 Sep 2022, the Dollar Index (DXY) began a weekly correction. What followed was a clear 5-wave decline, bottoming at 99.75 on 17 Jul 2023 — marking the completion of Wave A.
From there, the index rallied in 3 waves, reaching a high of 110 on 23 Dec 2024, forming Wave B. Currently, the C wave decline looks nearly complete as of 26 Jan, with price also testing the 200 EMA on the monthly chart.
⚡ Key Signal to Watch:
If DXY crosses above 100, it could signal the start of a new bull cycle, with potential upside targets in the 110–120 range.
🔑 Takeaway:
The structure suggests a zig-zag correction is unfolding, and the next move could define the dollar’s medium-term trend.
TechnicalAnalysis #DXY #Forex #TradingInsights #MarketOutlook
İlgili yayınlar
Feragatname
Bilgiler ve yayınlar, TradingView tarafından sağlanan veya onaylanan finansal, yatırım, alım satım veya diğer türden tavsiye veya öneriler anlamına gelmez ve teşkil etmez. Kullanım Koşulları bölümünde daha fazlasını okuyun.
İlgili yayınlar
Feragatname
Bilgiler ve yayınlar, TradingView tarafından sağlanan veya onaylanan finansal, yatırım, alım satım veya diğer türden tavsiye veya öneriler anlamına gelmez ve teşkil etmez. Kullanım Koşulları bölümünde daha fazlasını okuyun.