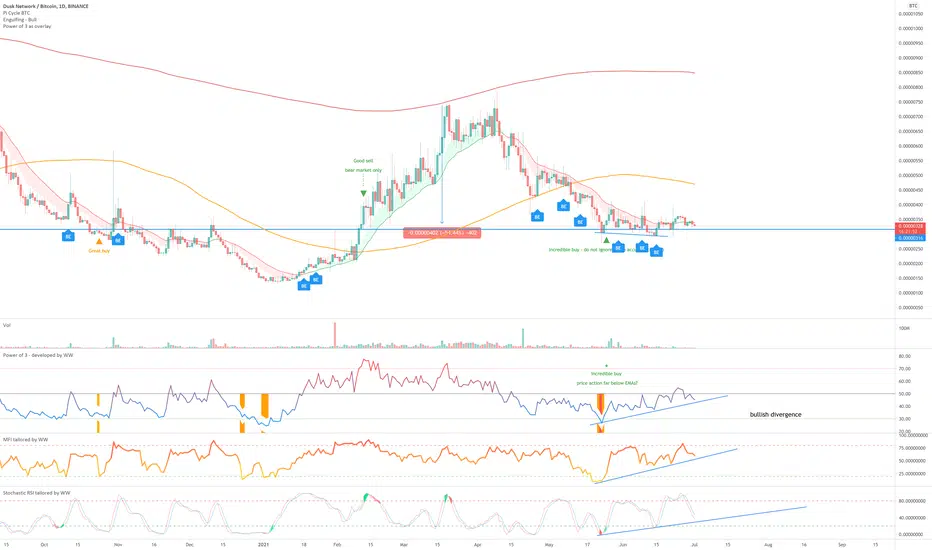
On the above 1-day chart price action has corrected 50% since mid-March with a oversold condition (orange column). A ‘incredible buy’ condition now exists following the regular bullish divergence between price action and all oscillators. Perfect.
On the 3-day chart (below) price action is printing bullish engulfing candles on past resistance as Stochastic RSI crossed up 20.
Is it possible price action falls further? Sure.
Is it probable? Unlikely, strong probability of upside move.
1st target 600 sats.

On the 3-day chart (below) price action is printing bullish engulfing candles on past resistance as Stochastic RSI crossed up 20.
Is it possible price action falls further? Sure.
Is it probable? Unlikely, strong probability of upside move.
1st target 600 sats.
İşlem aktif
İşlem aktif
RSI crosses 50 following a break of past resistance. A rotation back into BTC is projected around mid-late September.İşlem aktif
2nd 'incredible buy' signal + bullish divergence between price action and the oscillators.İşlem aktif
Not
'great sell' alert Feragatname
Bilgiler ve yayınlar, TradingView tarafından sağlanan veya onaylanan finansal, yatırım, işlem veya diğer türden tavsiye veya tavsiyeler anlamına gelmez ve teşkil etmez. Kullanım Şartları'nda daha fazlasını okuyun.
Feragatname
Bilgiler ve yayınlar, TradingView tarafından sağlanan veya onaylanan finansal, yatırım, işlem veya diğer türden tavsiye veya tavsiyeler anlamına gelmez ve teşkil etmez. Kullanım Şartları'nda daha fazlasını okuyun.