Pattern Observation
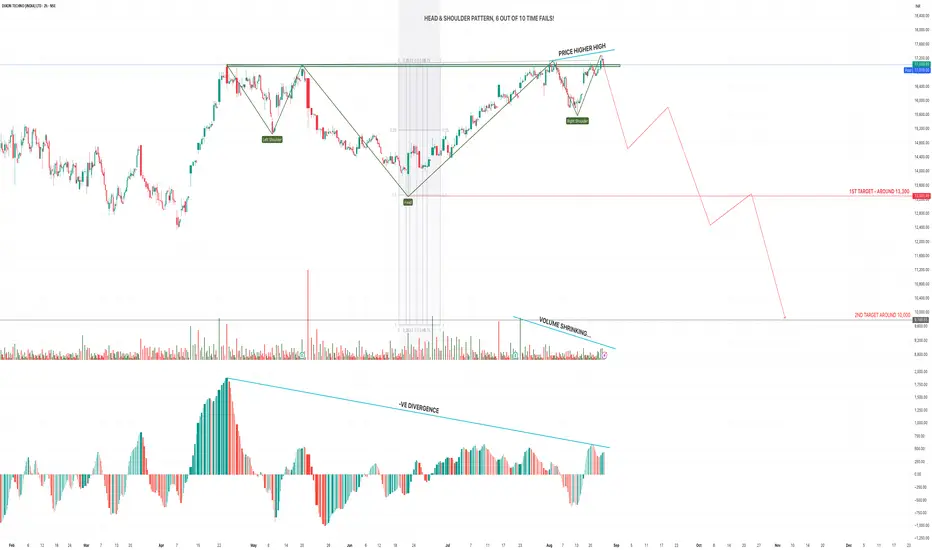
A clear Head & Shoulder structure is visible:
Left Shoulder: Early swing high before correction.
Head: Strong push making the highest peak.
Right Shoulder: Lower momentum retest of highs.
However, you’ve noted correctly on the chart — H&S often fails (6/10 times) in bullish continuation trends.
Technical Signals
Price Action
Price has made a higher high despite forming the right shoulder.
This is a contradictory signal because a true H&S generally requires a lower high on the right shoulder.
Suggests buying strength still exists.
Volume
Clear shrinking volume trend during right shoulder formation.
This indicates weakening participation and supports potential breakdown.
Momentum
Shown oscillator is diverging negatively (lower highs on oscillator vs higher highs on price).
Classic bearish divergence → supports the H&S breakdown case.
Levels to Watch
Neckline Zone: Around 16,800–17,000. A decisive break below confirms the pattern.
1st Target: 13,300 (strong horizontal support zone).
2nd Target: 10,000 (major fib retracement + strong demand area).
Risk Management
Invalidation: If Dixon sustains and closes above 17,200–17,300, H&S pattern fails and stock could move into fresh bullish continuation.
Stop Loss for Shorts: Keep near 17,300.
Positioning: Best to wait for volume-supported neckline breakdown before shorting.
Conclusion
Dixon is at a critical decision point.
Bearish case: Negative divergence + shrinking volume favor H&S breakdown → targets 13,300 → 10,000.
Bullish case: Sustained close above 17,200–17,300 will negate the pattern and extend rally.
📌 Disclaimer: This is a technical analysis view, not financial advice. Please manage risk as per your trading plan.
Feragatname
Bilgiler ve yayınlar, TradingView tarafından sağlanan veya onaylanan finansal, yatırım, alım satım veya diğer türden tavsiye veya öneriler anlamına gelmez ve teşkil etmez. Kullanım Koşulları bölümünde daha fazlasını okuyun.
Feragatname
Bilgiler ve yayınlar, TradingView tarafından sağlanan veya onaylanan finansal, yatırım, alım satım veya diğer türden tavsiye veya öneriler anlamına gelmez ve teşkil etmez. Kullanım Koşulları bölümünde daha fazlasını okuyun.