📌 Dixon Technologies (NSE: DIXON) – Key Levels & Market Outlook
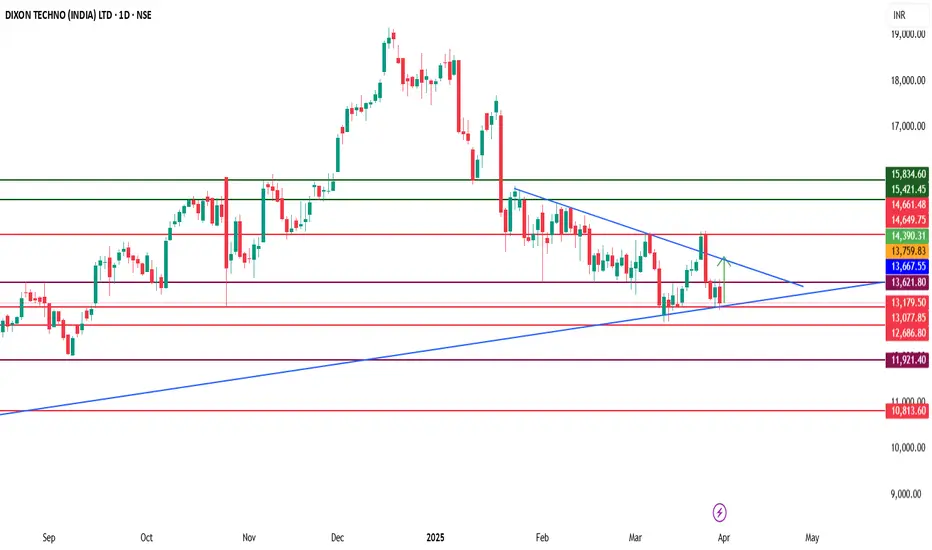
Dixon Technologies (DIXON) is currently trading above a crucial support zone of ₹13,000-₹12,800. If the stock sustains this level and breaks above the ₹13,630 resistance, it could see an upside move toward ₹14,000-₹14,600. However, a breakdown below ₹12,800 may lead to further downside pressure.
🔍 Technical Indicators:
📊 Supertrend (10,3): The indicator is currently in a buy mode, supporting a bullish outlook as long as ₹12,800 holds.
📈 Fibonacci Retracement: The ₹13,630 resistance aligns with a key retracement level; a breakout above this could confirm strength.
📉 ADX (Average Directional Index): Currently at 23, suggesting a developing trend; a move above 25-30 would indicate strong bullish momentum.
📊 OBV (On-Balance Volume): Rising OBV signals strong accumulation, supporting an upward breakout scenario.
📌 Key Levels to Watch:
✅ Support Zone: ₹13,000-₹12,800
📍 Resistance Level: ₹13,630
🚀 Upside Targets: ₹14,000-₹14,600
⚠ Breakdown Risk: Below ₹12,800, the stock may slide toward ₹12,500.
A sustained move above ₹13,630 could accelerate buying momentum, pushing Dixon toward ₹14,000-₹14,600. On the other hand, a break below ₹12,800 may invite selling pressure. Keep an eye on sector trends, demand in electronics, and institutional activity for further confirmation.
Feragatname
Bilgiler ve yayınlar, TradingView tarafından sağlanan veya onaylanan finansal, yatırım, işlem veya diğer türden tavsiye veya tavsiyeler anlamına gelmez ve teşkil etmez. Kullanım Şartları'nda daha fazlasını okuyun.
Feragatname
Bilgiler ve yayınlar, TradingView tarafından sağlanan veya onaylanan finansal, yatırım, işlem veya diğer türden tavsiye veya tavsiyeler anlamına gelmez ve teşkil etmez. Kullanım Şartları'nda daha fazlasını okuyun.