📈 1-Month Performance Snapshot (September 9 – October 9, 2025)
Opening Price (Sep 9, 2025): ₹6,025.00
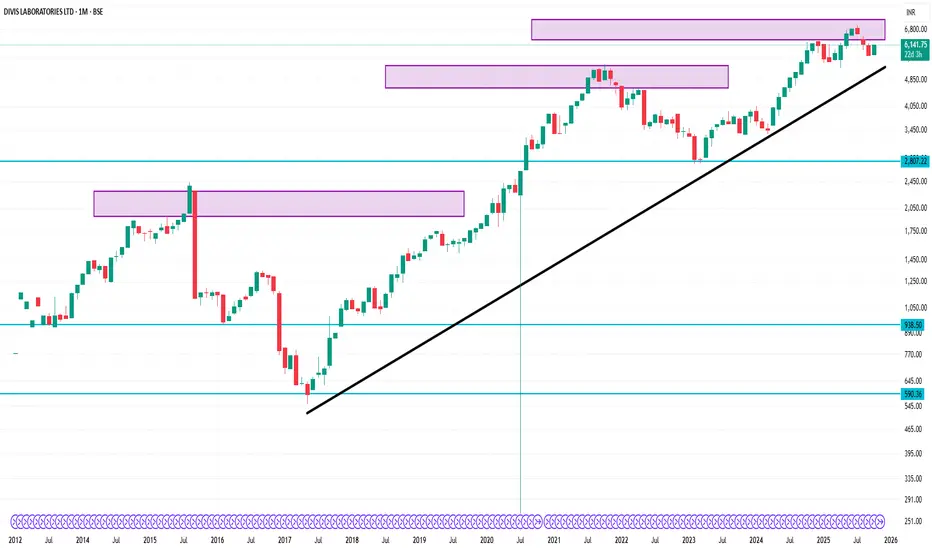
Closing Price (Oct 9, 2025): ₹6,149.00
Price Change: +₹124.00 (+2.06%)
52-Week Range: ₹4,955.00 – ₹7,071.50
Current Price vs. 52-Week High: -12.98%
Current Price vs. 52-Week Low: +24.14%
Trading Volume (Oct 9): Approximately 129,890 shares
5-Day Moving Average: ₹6,128.00
20-Day Exponential Moving Average (EMA): ₹6,110.08
1-Month Return: +1.54%
📊 Recent Performance Highlights
October 8, 2025: Closed at ₹6,120.50 (+0.26%)
October 7, 2025: Closed at ₹6,104.50 (+4.77%)
October 6, 2025: Closed at ₹5,826.50 (-0.67%)
October 3, 2025: Closed at ₹5,866.00 (+2.73%)
October 1, 2025: Closed at ₹5,710.00 (+0.36%)
🧾 Key Financial Metrics
P/E Ratio (TTM): 70.29
EPS (TTM): ₹86.80
Market Capitalization: ₹1.62 trillion
Dividend Yield: 0.49%
Debt-to-Equity Ratio: 0.00 (indicating a debt-free status)
Opening Price (Sep 9, 2025): ₹6,025.00
Closing Price (Oct 9, 2025): ₹6,149.00
Price Change: +₹124.00 (+2.06%)
52-Week Range: ₹4,955.00 – ₹7,071.50
Current Price vs. 52-Week High: -12.98%
Current Price vs. 52-Week Low: +24.14%
Trading Volume (Oct 9): Approximately 129,890 shares
5-Day Moving Average: ₹6,128.00
20-Day Exponential Moving Average (EMA): ₹6,110.08
1-Month Return: +1.54%
📊 Recent Performance Highlights
October 8, 2025: Closed at ₹6,120.50 (+0.26%)
October 7, 2025: Closed at ₹6,104.50 (+4.77%)
October 6, 2025: Closed at ₹5,826.50 (-0.67%)
October 3, 2025: Closed at ₹5,866.00 (+2.73%)
October 1, 2025: Closed at ₹5,710.00 (+0.36%)
🧾 Key Financial Metrics
P/E Ratio (TTM): 70.29
EPS (TTM): ₹86.80
Market Capitalization: ₹1.62 trillion
Dividend Yield: 0.49%
Debt-to-Equity Ratio: 0.00 (indicating a debt-free status)
İlgili yayınlar
Feragatname
Bilgiler ve yayınlar, TradingView tarafından sağlanan veya onaylanan finansal, yatırım, alım satım veya diğer türden tavsiye veya öneriler anlamına gelmez ve teşkil etmez. Kullanım Koşulları bölümünde daha fazlasını okuyun.
İlgili yayınlar
Feragatname
Bilgiler ve yayınlar, TradingView tarafından sağlanan veya onaylanan finansal, yatırım, alım satım veya diğer türden tavsiye veya öneriler anlamına gelmez ve teşkil etmez. Kullanım Koşulları bölümünde daha fazlasını okuyun.