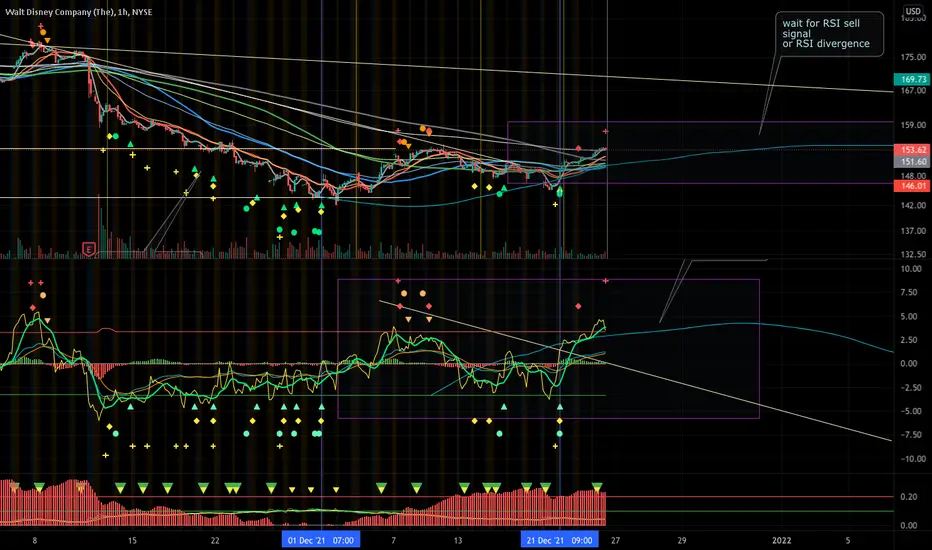
DISNEY (1-hour chart) had higher lows on 21 Dec compared with 1 Dec, with SMA20, SMA60 and SMA120 moving uptrend indicating a possible bottoming up and reversal.
1D chart showing RSI divergence in Nov resulting in the lowest low of 142 on 1 Dec.
1H chart showing overbought signal now. Wait a while to enter a trade when the price retracted.
Buy @ 151
Stop loss @ 146
Profit @ 169
Profit to loss ratio 3.2
1D chart showing RSI divergence in Nov resulting in the lowest low of 142 on 1 Dec.
1H chart showing overbought signal now. Wait a while to enter a trade when the price retracted.
Buy @ 151
Stop loss @ 146
Profit @ 169
Profit to loss ratio 3.2
Feragatname
Bilgiler ve yayınlar, TradingView tarafından sağlanan veya onaylanan finansal, yatırım, işlem veya diğer türden tavsiye veya tavsiyeler anlamına gelmez ve teşkil etmez. Kullanım Şartları'nda daha fazlasını okuyun.
Feragatname
Bilgiler ve yayınlar, TradingView tarafından sağlanan veya onaylanan finansal, yatırım, işlem veya diğer türden tavsiye veya tavsiyeler anlamına gelmez ve teşkil etmez. Kullanım Şartları'nda daha fazlasını okuyun.