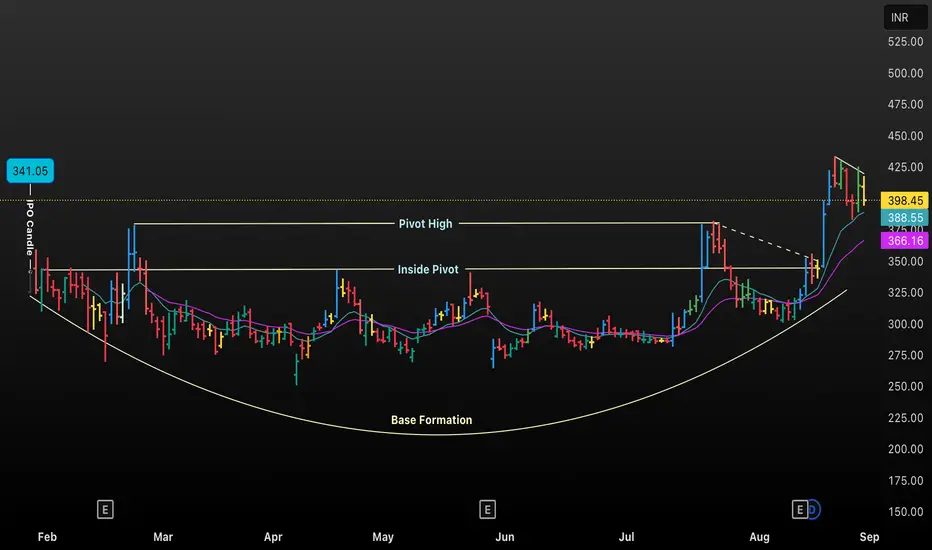
The chart displays the daily price candles for DENTA, highlighting key technical levels: the Pivot High, Inside Pivot, and the rounded Base Formation that characterizes a classic Cup and Handle chart pattern. The IPO Candle signifies the initial price action post-listing. As prices gradually form a rounded bottom, accumulation occurs, followed by an upward breakout above the resistance (Pivot High), indicating bullish momentum. The colored moving averages provide additional context for trend strength and potential support levels.
Feragatname
Bilgiler ve yayınlar, TradingView tarafından sağlanan veya onaylanan finansal, yatırım, alım satım veya diğer türden tavsiye veya öneriler anlamına gelmez ve teşkil etmez. Kullanım Koşulları bölümünde daha fazlasını okuyun.
Feragatname
Bilgiler ve yayınlar, TradingView tarafından sağlanan veya onaylanan finansal, yatırım, alım satım veya diğer türden tavsiye veya öneriler anlamına gelmez ve teşkil etmez. Kullanım Koşulları bölümünde daha fazlasını okuyun.