Maybe its is 'parabonoma'
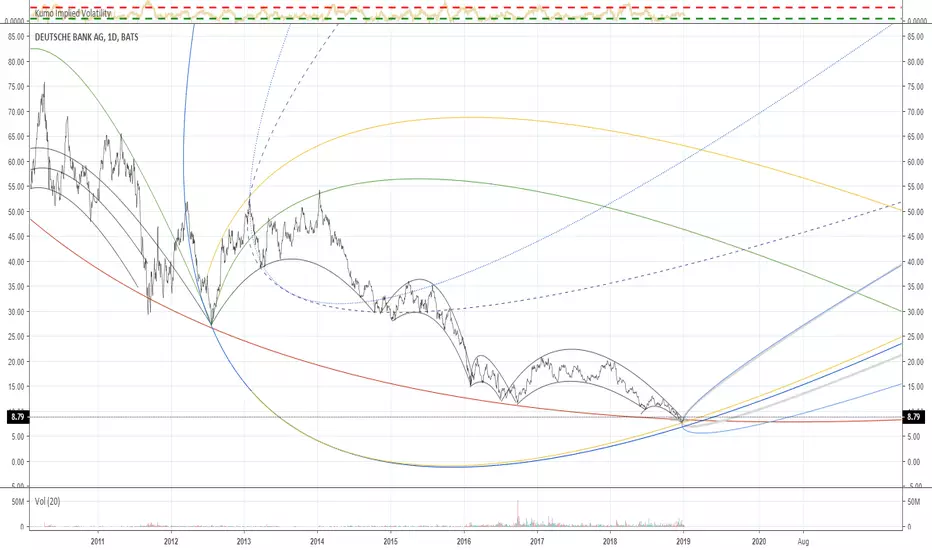
21 March 2012, to 24 July 2012
this maps to the present moment.
that is the corridor in Solid Blue/yellow dividing bilaterally the parabolas engendered by the break out of life. Will it survive. . . Cliff hanger
Is this phenomena, math? Weird chaos ripples?
21 March 2012, to 24 July 2012
this maps to the present moment.
that is the corridor in Solid Blue/yellow dividing bilaterally the parabolas engendered by the break out of life. Will it survive. . . Cliff hanger
Is this phenomena, math? Weird chaos ripples?
Not
The curves are focused when the Blue and Yellow are focused. These are the same line. If They appear close, that is where in the pan the other parabolas are accurate.Not
This chart, in review, is the prescient one./İlgili yayınlar
Feragatname
Bilgiler ve yayınlar, TradingView tarafından sağlanan veya onaylanan finansal, yatırım, işlem veya diğer türden tavsiye veya tavsiyeler anlamına gelmez ve teşkil etmez. Kullanım Şartları'nda daha fazlasını okuyun.
İlgili yayınlar
Feragatname
Bilgiler ve yayınlar, TradingView tarafından sağlanan veya onaylanan finansal, yatırım, işlem veya diğer türden tavsiye veya tavsiyeler anlamına gelmez ve teşkil etmez. Kullanım Şartları'nda daha fazlasını okuyun.