Current Chart Structure in CVOPRL:
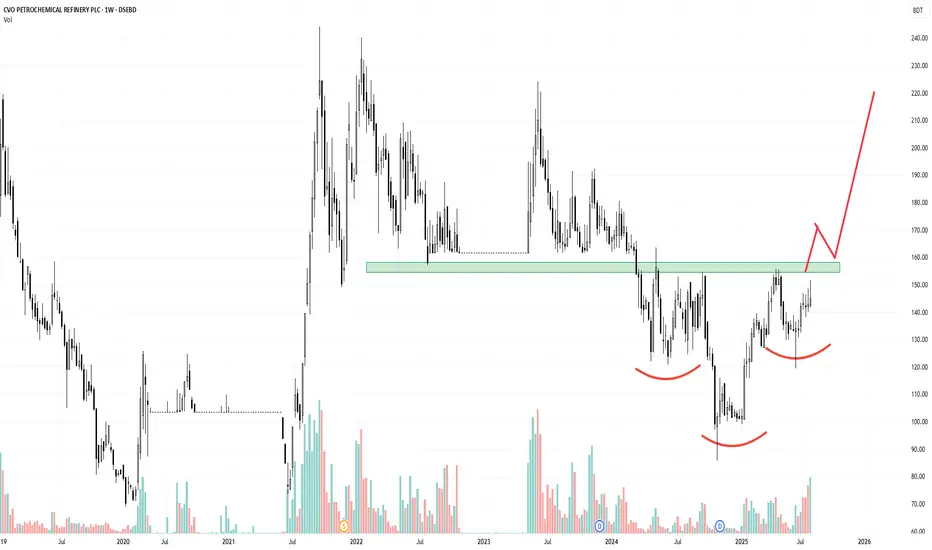
CVOPRL has been in a downtrend, but recently it's showing signs of reversal.
The price has formed a clear inverted head and shoulders pattern.
The neckline resistance is currently being tested.
Volume behavior shows early accumulation, which supports a bullish bias.
Momentum indicators (RSI/MACD) are starting to turn positive, suggesting bullish divergence with price.
Trading Plan & Strategy:
Don’t jump in early. Wait for confirmation.
What to watch for:
Breakout above the neckline with convincing volume.
Retest of the neckline support (previous resistance).
Bullish candle formation (like a hammer, bullish engulfing) during retest.
Entry Point: After a breakout and successful retest confirmation.
Feragatname
Bilgiler ve yayınlar, TradingView tarafından sağlanan veya onaylanan finansal, yatırım, işlem veya diğer türden tavsiye veya tavsiyeler anlamına gelmez ve teşkil etmez. Kullanım Şartları'nda daha fazlasını okuyun.
Feragatname
Bilgiler ve yayınlar, TradingView tarafından sağlanan veya onaylanan finansal, yatırım, işlem veya diğer türden tavsiye veya tavsiyeler anlamına gelmez ve teşkil etmez. Kullanım Şartları'nda daha fazlasını okuyun.