Overbought on weekly and daily RSI, not monthly. Rising wedges noted in chart. Just beware as rising wedges are most often bearish.
By looking at chart, I would think a pull back is coming very soon, although monthly candle looks good as does weekly candle. Just because it is overbought and a lot of green leading up to recent high. I would think someone is going to sell soon.
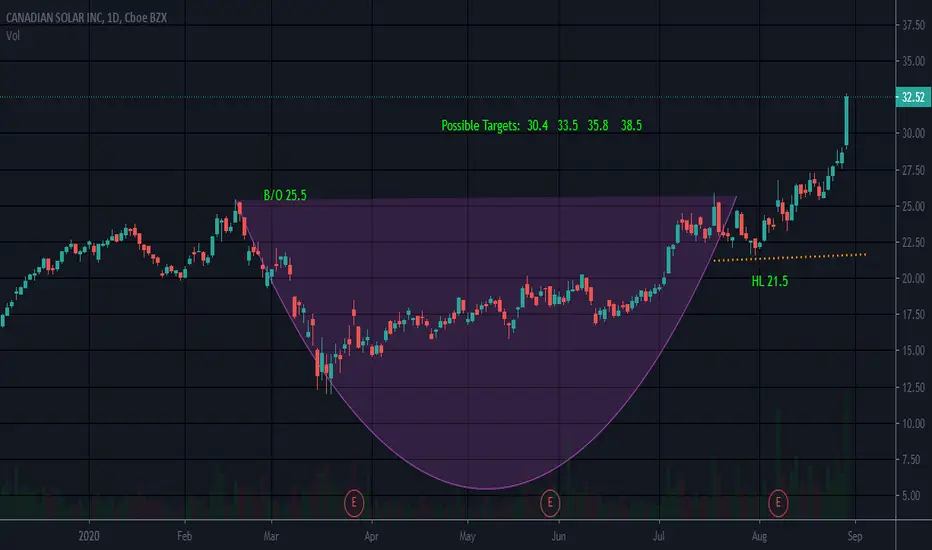
Possible stop below 18.5
I do not own this and it is Not a recommendation.
By looking at chart, I would think a pull back is coming very soon, although monthly candle looks good as does weekly candle. Just because it is overbought and a lot of green leading up to recent high. I would think someone is going to sell soon.
Possible stop below 18.5
I do not own this and it is Not a recommendation.
Not
may encounter R at 43 to 44ish from old high. 20 yr high is 51.80Feragatname
Bilgiler ve yayınlar, TradingView tarafından sağlanan veya onaylanan finansal, yatırım, alım satım veya diğer türden tavsiye veya öneriler anlamına gelmez ve teşkil etmez. Kullanım Koşulları bölümünde daha fazlasını okuyun.
Feragatname
Bilgiler ve yayınlar, TradingView tarafından sağlanan veya onaylanan finansal, yatırım, alım satım veya diğer türden tavsiye veya öneriler anlamına gelmez ve teşkil etmez. Kullanım Koşulları bölümünde daha fazlasını okuyun.