📉 🔴
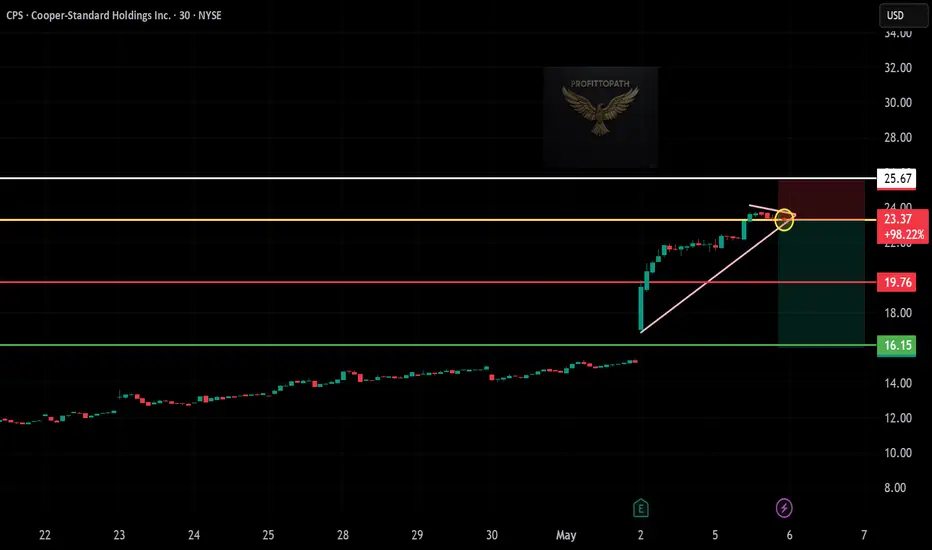
Ticker: CPS (Cooper-Standard Holdings Inc., NYSE: CPS)
Chart: 30-Minute Timeframe
Pattern: Rising wedge breakdown + trendline rejection
🔻 Entry: $23.37 (break below wedge + resistance rejection)
🔻 Stop-Loss: $25.67 (above wedge breakdown and structure)
🔻 Take Profits:
• TP1: $19.76 – First support zone
• TP2: $16.15 – Measured wedge breakdown target
⚖️ Risk-Reward:
• Risk/Share: $2.30
• Reward to TP2: $7.22
• R:R Ratio: ~1:3.1 ✅
🧠 Technical Highlights:
– Rising wedge pattern broken to downside
– Strong rejection at key resistance (yellow zone)
– Bearish confirmation after breakdown with retest
Feragatname
Bilgiler ve yayınlar, TradingView tarafından sağlanan veya onaylanan finansal, yatırım, alım satım veya diğer türden tavsiye veya öneriler anlamına gelmez ve teşkil etmez. Kullanım Koşulları bölümünde daha fazlasını okuyun.
Feragatname
Bilgiler ve yayınlar, TradingView tarafından sağlanan veya onaylanan finansal, yatırım, alım satım veya diğer türden tavsiye veya öneriler anlamına gelmez ve teşkil etmez. Kullanım Koşulları bölümünde daha fazlasını okuyun.