Alış
CND symmetric triangle on 15 minute - target 400 sats
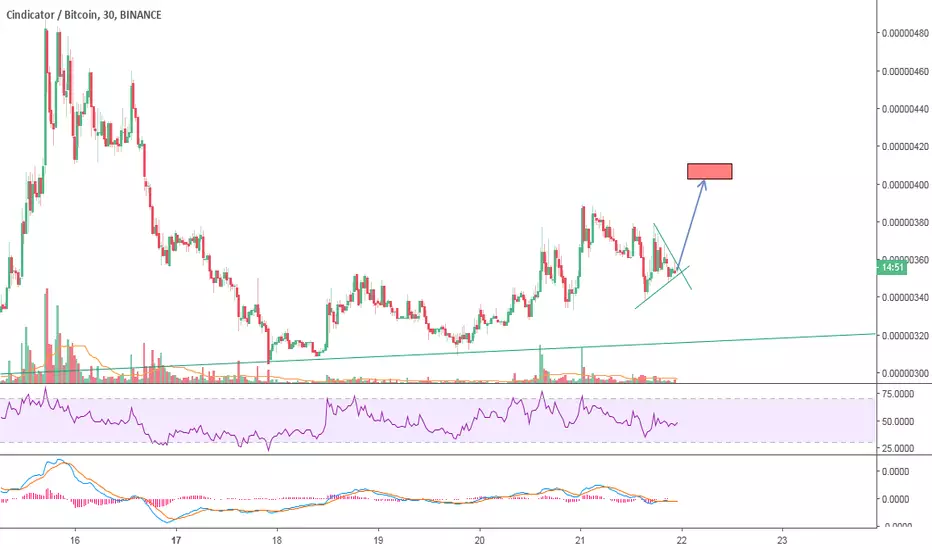
Just posting this for fun (and seeing if it comes true!). Symmetric triangle clearly visible on the 15 minute chart. Presumes ongoing bullish trend reversal has taken place in CND, which I identified approximately two weeks ago (prior to PBC pump). Can buy in now and sell at 400 sats for a quick profit. I could be wrong, though.
Feragatname
Bilgiler ve yayınlar, TradingView tarafından sağlanan veya onaylanan finansal, yatırım, işlem veya diğer türden tavsiye veya tavsiyeler anlamına gelmez ve teşkil etmez. Kullanım Şartları'nda daha fazlasını okuyun.
Feragatname
Bilgiler ve yayınlar, TradingView tarafından sağlanan veya onaylanan finansal, yatırım, işlem veya diğer türden tavsiye veya tavsiyeler anlamına gelmez ve teşkil etmez. Kullanım Şartları'nda daha fazlasını okuyun.